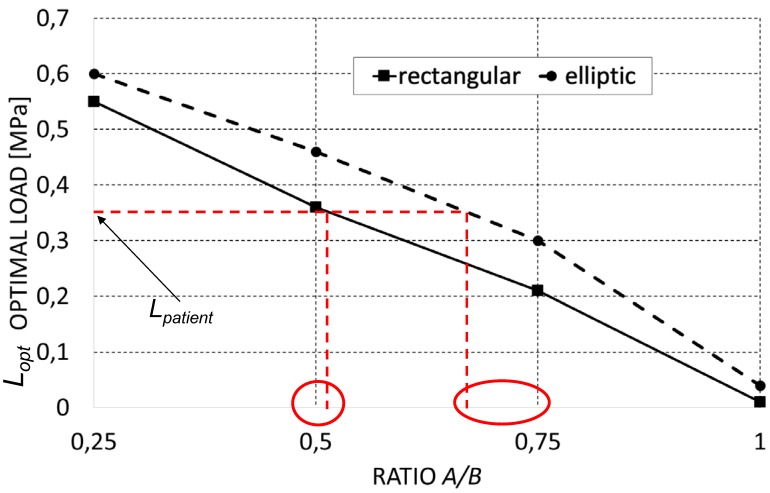
Figure 4.
Optimal load (expressed as load per unit area, [N/mm2]) predicted by the optimization algorithm for the different scaffold geometries investigated in the study. The diagram can be properly utilized to choose the best scaffold geometry that is better suited for the specific patient requirements. Let us suppose, for example, that a value of Lpatient = 0,35 MPa was found. It appears that the best scaffold geometry that can be selected by the surgeon is the one with rectangular pores and a ratio A/B = 0,5. The second best solution is a scaffold with elliptic pores and with A/B = 0,75.

