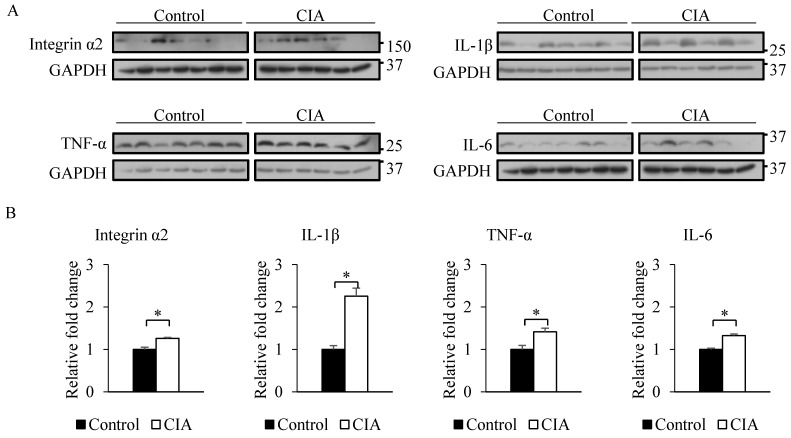
Figure 3.
Validation of microarray and proteome array results by western blotting. (A) Western blotting was performed using blood samples from control and CIA mice. GAPDH served as an internal control. (B) Relative fold change in band intensity of target proteins normalized to GAPDH level. Data represent the mean ± SEM. *P < 0.05

