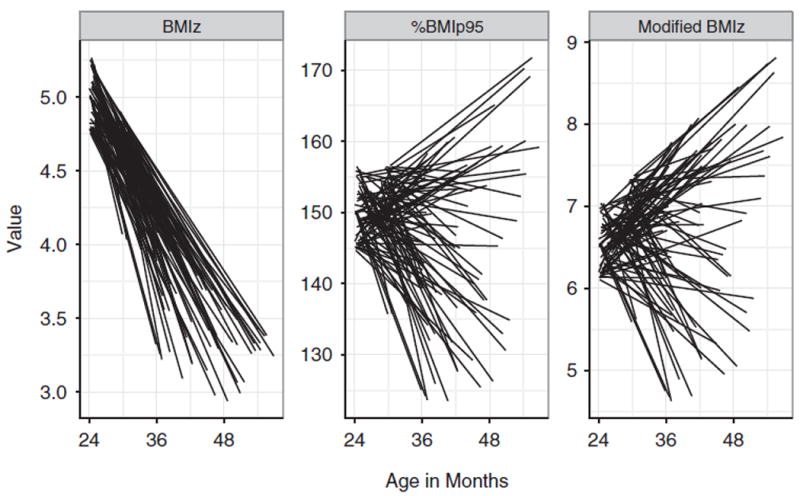
Figure 2.

Line plots showing changes in BMIz and %BMIp95 among the 100 girls with the highest BMIz values (≥4.75) at the initial examination. Each line represents the value of the BMI metric at the two examinations for a single girl. Age is shown on the x-axis.
