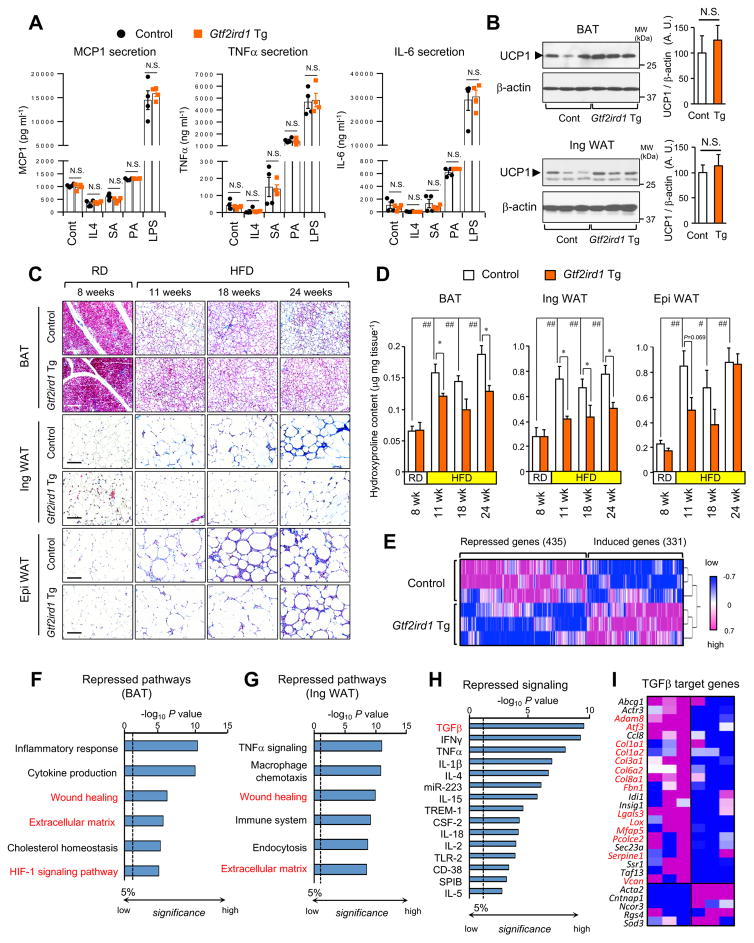
Figure 3. Adipose-selective expression of Gtf2ird1 represses adipose tissue fibrosis in vivo.
(A) Concentration of MCP-1, TNF-a and IL-6 secreted from the macrophages from Gtf2ird1 Tg mice and the littermate control mice (control). The isolated macrophages were stimulated with IL4, stearic acid (SA), palmitic acid (PA), or lipopolysaccharide (LPS). n=4.
(B) Immunoblotting for UCP1 in the BAT (upper panel) and the inguinal WAT (bottom panel) from Gtf2ird1 Tg mice and controls under ambient temperature. n=6–7. β-actin was used as loading control. Quantification of the UCP1 signal normalized by β-actin is shown on the right graphs. N.S., not significant.
(C) Masson’s trichrome staining in the BAT, the WAT and the epididymal WAT from Gtf2ird1 Tg and controls under 8 weeks of RD or HDF for 11, 18, and 24 weeks. Scale bars = 100 μm.
(D) Hydroxyproline content in the adipose tissues of mice in (C). * P<0.05 between Gtf2ird1 Tg mice and controls. # P<0.05, ## P<0.01 between RD and HFD. n= 5. Data in A, B, and D are represented as mean ± SEM.
(E) Hierarchical clustering and heat-map of RNA-seq transcriptome in the BAT of control and Gtf2ird1 Tg mice. The color scale shows z-scored FPKM representing the mRNA level of each gene in blue (low expression)-white-red (high expression) scheme.
(F) Repressed biological pathways in the BAT of Gtf2ird1 Tg mice and controls by Metascape.
(G) Repressed biological pathways in the inguinal WAT of Gtf2ird1 Tg mice and controls by Metascape.
(H) Ingenuity upstream analysis identified repressed signaling pathways in the BAT of Gtf2ird1 Tg mice.
(I) Expression profiles of the TGF-β regulated genes in the BAT of control and Gtf2ird1 Tg mice. Genes with red letters represent pro-fibrosis genes.

