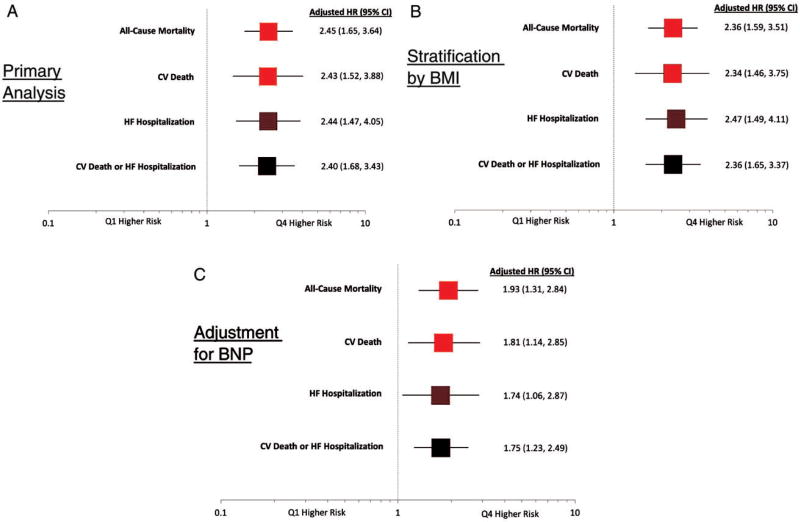
Figure 2.
A–C, Adjusted hazard ratios are shown for Q4 vs Q1 adiponectin concentration for all-cause mortality, death from CV causes, HF hospitalization, and death from CV causes or HF hospitalization for the (A) primary analysis, (B) with stratification by BMI, and (C) with inclusion of BNP in the adjustment model. The covariates used for adjustment were age, sex, index event, prior heart failure, eGFR, HTN, treatment arm, and BNP (panel C only)

