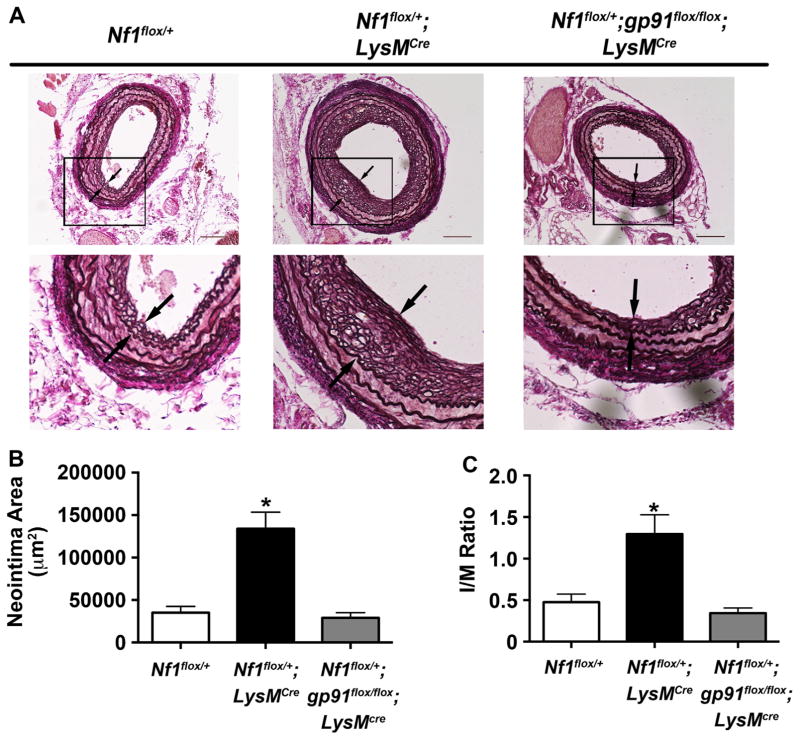
Fig. 5.
Lineage restricted deletion of gp91phox in myeloid cells inhibits Nf1+/− neointima formation. Representative photomicrographs (A) and quantification of neointima area (B and C) of injured carotid arteries from WT, Nf1flox/+;LysMcre, and Nf1flox/+;gp91flox/flox;LysMcre mice. A. Black arrows indicate neointima boundaries. Black boxes identify area of injured artery that is magnified below. Scale bars: 100 μm. B and C. Quantification of neointima area (B) and I/M ratio (C) of injured carotid arteries from WT, Nf1flox/+;LysMcre, and Nf1flox/+;gp91flox/flox;LysMcre mice. Data represent mean neointima area or I/M ratio±SEM, n=10–12. *P<0.001 for WT, and Nf1flox/+;gp91flox/flox;LysMcre mice versus Nf1flox/+;LysMcre.

