Fig. 7.
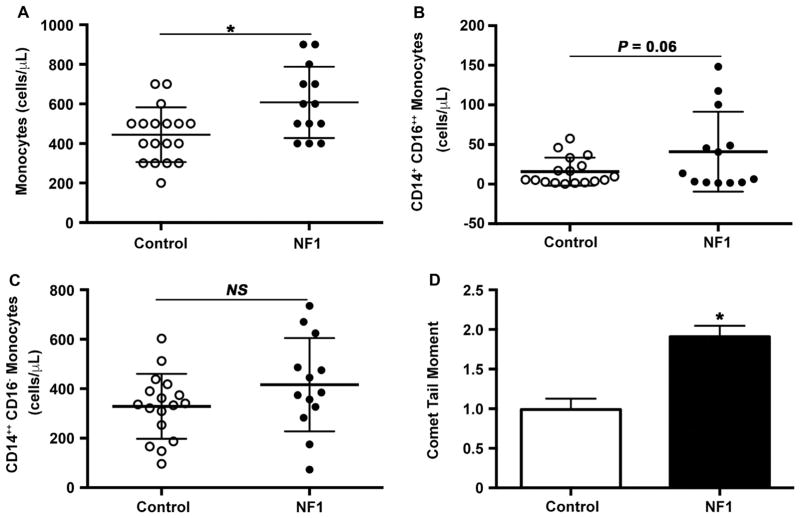
NF1 patients have evidence of chronic inflammation and oxidative stress. Quantification of total monocyte count (A), CD14+CD16+ + monocyte count (B), and peripheral blood MNC comet tail moment (C) in NF1 patients and age-, sex-matched controls. A. Data represent total monocyte count (cells/μL) for NF1 patients (n=13) and controls (n=18). P<0.01 for NF1 patients versus control patients. B. Data represent CD14+CD16+ + monocytes (cells/μL) for NF1 patients (n=13) and controls (n=17). C. Data represent CD14+ +CD16− monocytes (cells/μL) for NF1 patients (n=13) and controls (n=17). D. Data represent mean comet tail moment±S.D. for NF1 patients (n=10) versus controls (n=28). P<0.05 for NF1 versus control patients.

