Figure 1.

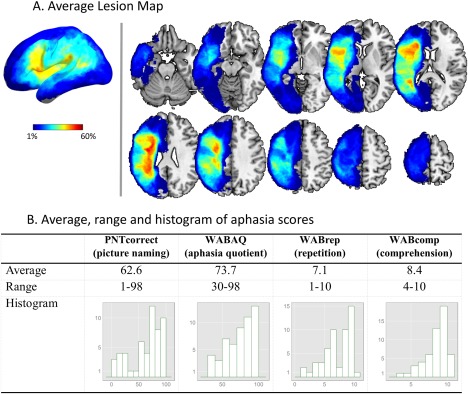
(A) Surface and slice views of the average lesion map. (B) Average, range, and histogram, of true aphasia score measured from patients. [Color figure can be viewed at http://wileyonlinelibrary.com]

(A) Surface and slice views of the average lesion map. (B) Average, range, and histogram, of true aphasia score measured from patients. [Color figure can be viewed at http://wileyonlinelibrary.com]