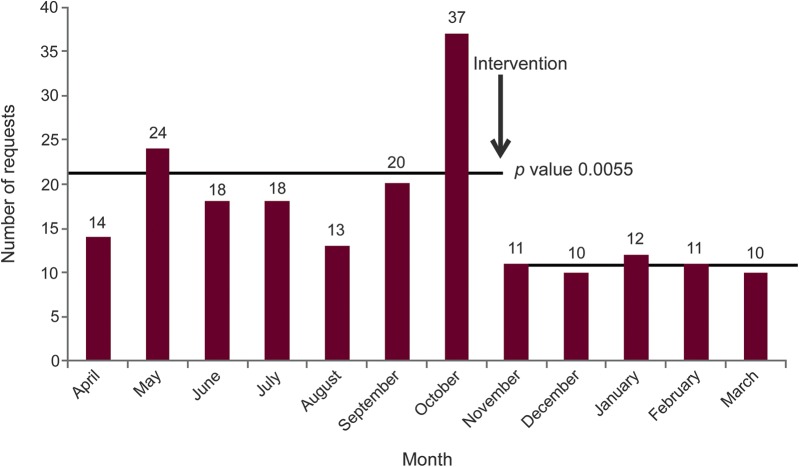
Figure. Prescription refill requests.
Number of prescription refill requests received after hours during the study period. Time of intervention denoted by the arrow. Preintervention and postintervention averages of 21 and 11 requests per month, respectively, indicated by the solid lines (p = 0.0055).

