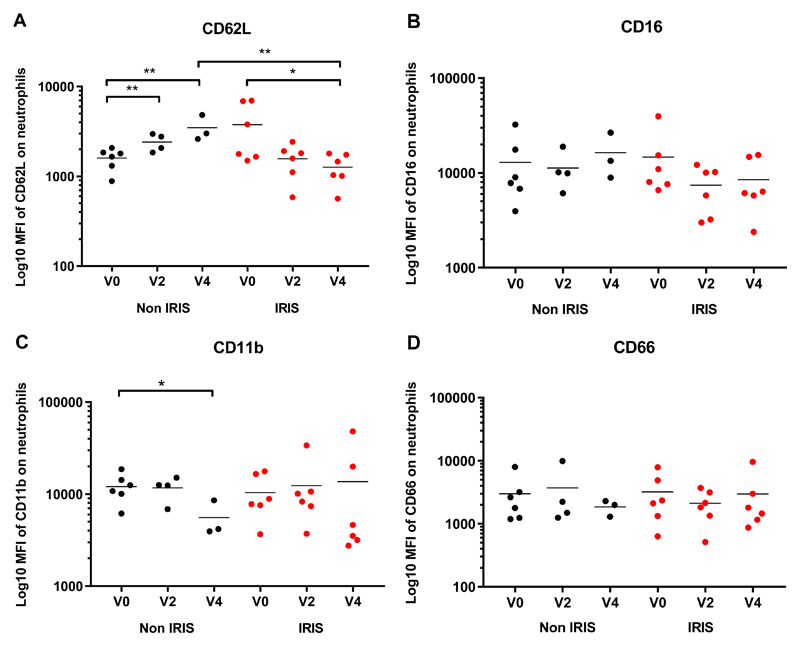
Figure 3. Neutrophil activation in TB-IRIS patients and Non-IRIS controls:
The Median Fluorescence Intensity of CD62L (A), CD16 (B), CD11b (C) and CD66a,c,e (D) on neutrophils in fresh whole blood is shown for TB-IRIS patients (red, n=6) and non-IRIS controls (black, n=6 at ART initiation (Week (W) 0), n = 4 at W2, n = 3 at W4). Lines represent means and p-values (* p < 0.05, ** p < 0.01) were derived from unpaired and paired t tests.

