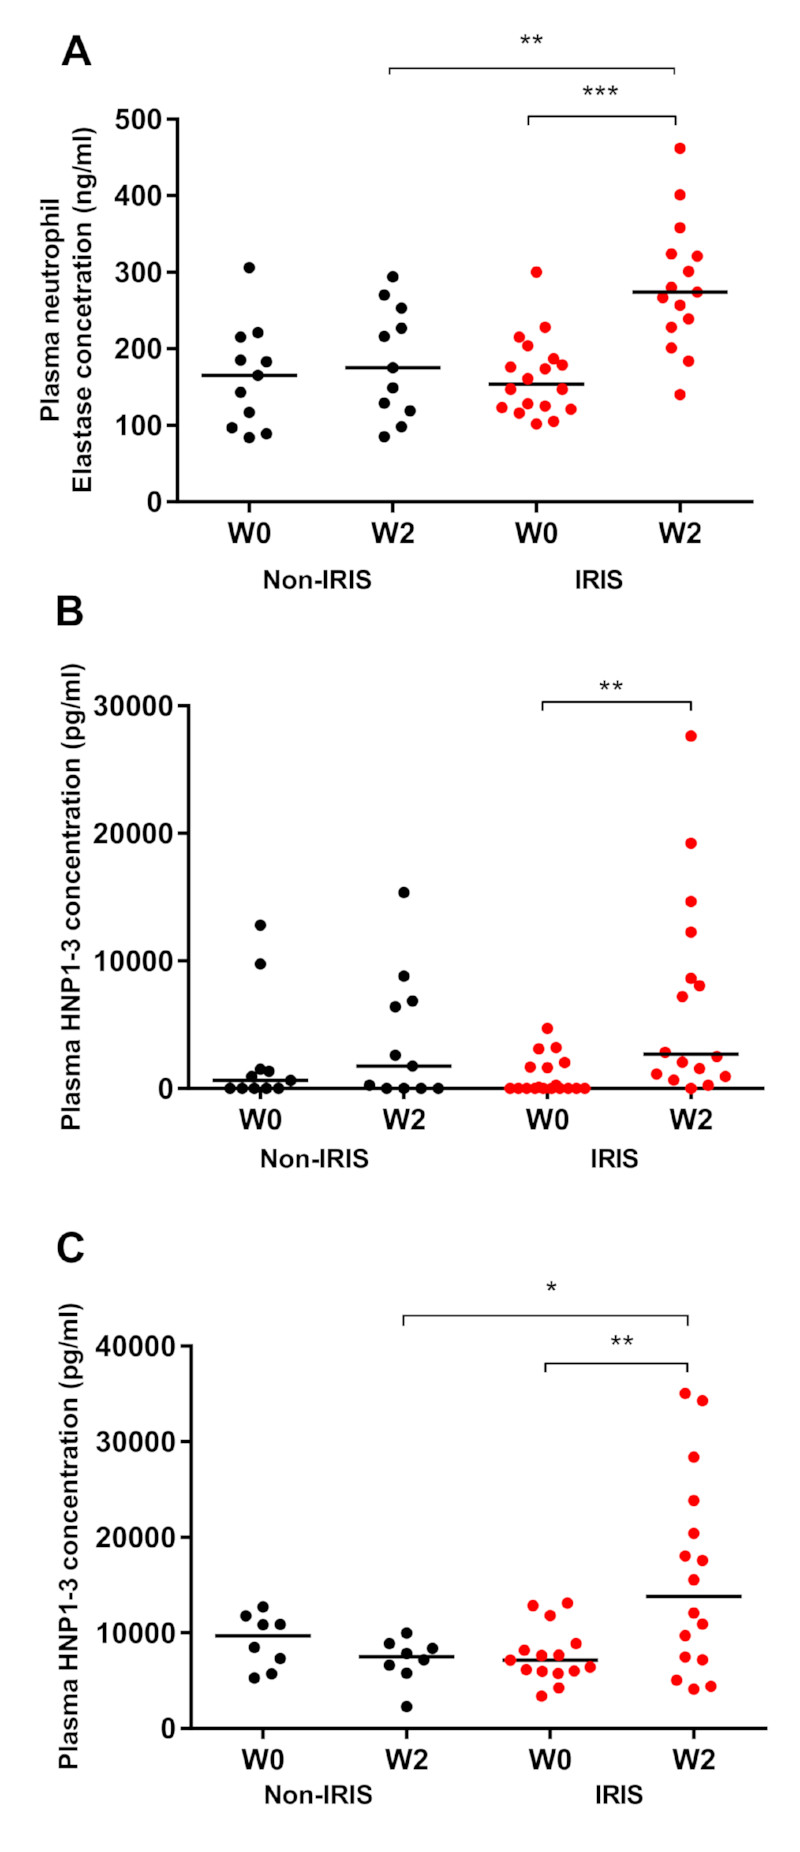
Figure 4. Analysis of plasma levels of neutrophil elastase and HNP1-3 in patients with TB-IRIS and non-IRIS controls.
A. Neutrophil Elastase (TB-IRIS patients (red, n = 18 at ART initiation, n = 15 at W2) and non-IRIS controls (black n = 11)) plasma concentrations were quantified using ELISA in Cohort 2. B. Human Neutrophil Peptide (HNP) 1-3 (TB-IRIS patients (red, n = 18 at ART initiation, n = 16 at W2) and non-IRIS controls (black n = 11)) plasma concentrations were quantified using ELISA in Cohort 2. C. Human Neutrophil Peptide (HNP) 1-3 plasma concentrations were quantified using ELISA in Cohort 1 (TB-IRIS patients (n =15 at ART initiation, n = 16 at W2) and non-IRIS controls (n = 8)). Lines represent medians and p-values (** p < 0.01, *** p < 0.001) were derived from Mann-Whitney and Wilcoxon tests.

