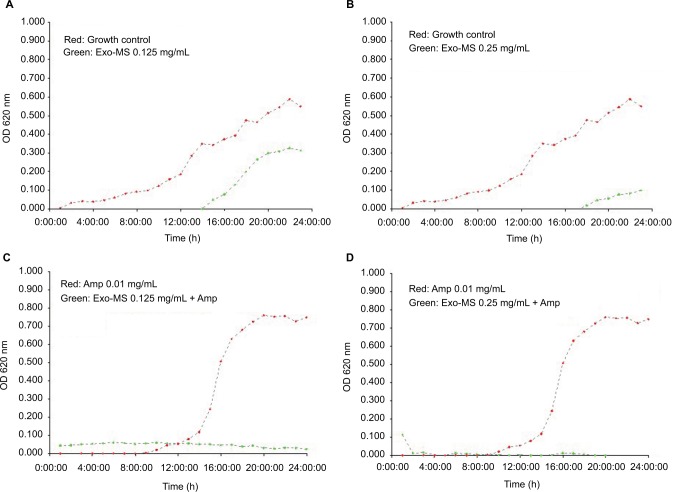
Figure 4.
Growth curves of methicillin-resistant Staphylococcus aureus in the presence of Exo-MS.
Notes: (A) and (B) plot in red: growth curves of the isolate in medium alone and plot in green show curves in the presence of Exo-MS at 0.125 and 0.25 mg/mL, respectively; (C) and (D) plot in red: growth curves of the isolate in the presence of ampicillin 0.01 mg/mL and plot in green show curves in the presence of Exo-MS 0.125 and 0.25 mg/mL, respectively, along with ampicillin 0.01 mg/mL.
Abbreviations: Amp, ampicillin; Exo-MS, exochelin-MS; OD, optical density.

