
Figure 1.
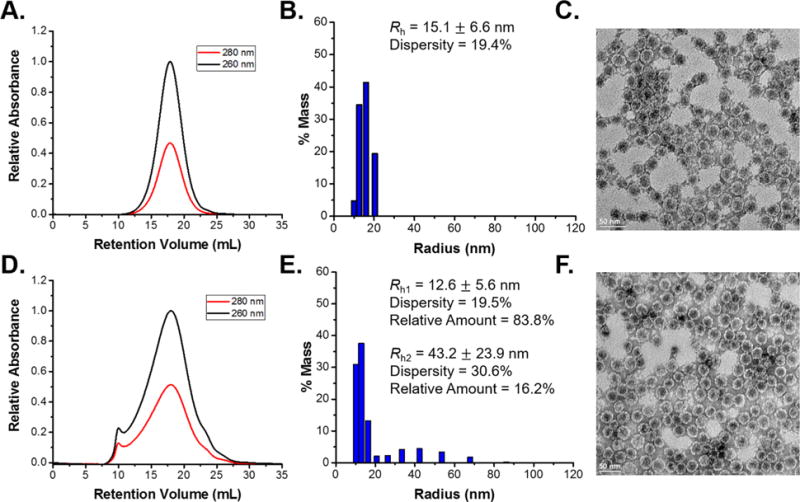
(A) FPLC chromatogram. (B) DLS histogram. (C) TEM image of Qβ showing the typical Gaussian peak on the chromatogram and expected sizes in the DLS and TEM results. (D) FPLC chromatogram. (E) DLS histogram. (F) TEM image of recovered Qβ after melt-encapsulation with PLGA. The peak at 10 mL in the FPLC chromatogram corresponded to aggregated species eluting at the void volume, which also appear as the larger peak in the DLS histogram. The TEM result, along with the FPLC and DLS results, indicated that a large proportion of the particles remain intact and are of the correct size.