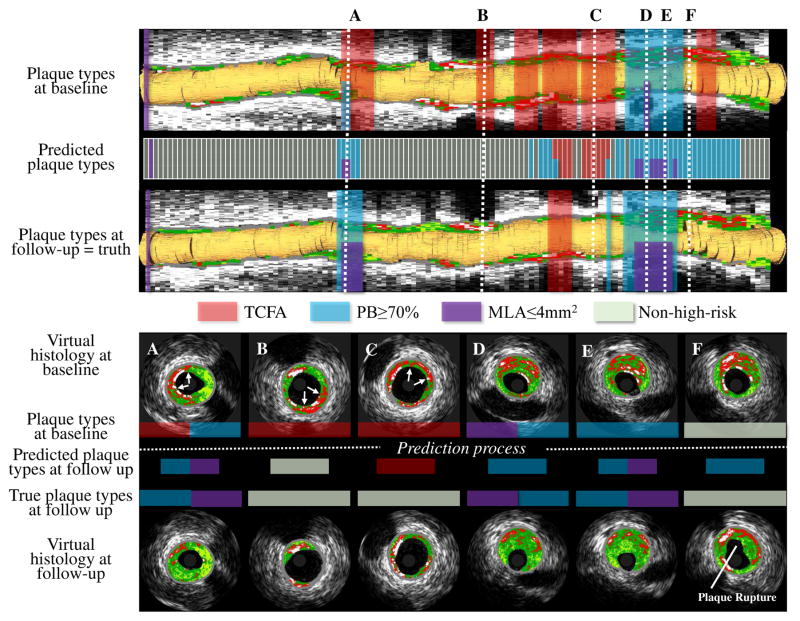
Fig. 9.
Future high-risk plaque locations. Upper panel: Baseline VH-IVUS pullback with high-risk plaque risk locations (first row), predicted follow-up high-risk plaque locations (second row), and ground-truth at follow-up (third row). TCFA in red; PB≥70% blue; MLA≤4mm2 purple. Lower panel: Cross-sectional VH-IVUS frames at the six locations marked in the upper panel. A: TCFA healed, PB≥70% unchanged, and new MLA≤4mm2 occurred. B: TCFA healed. C: TCFA healed. D: PB≥70% and MLA≤4mm2 unchanged. E: PB≥70% unchanged while new MLA≤4mm2 present. F: No high-risk plaque with plaque rupture at follow-up.

