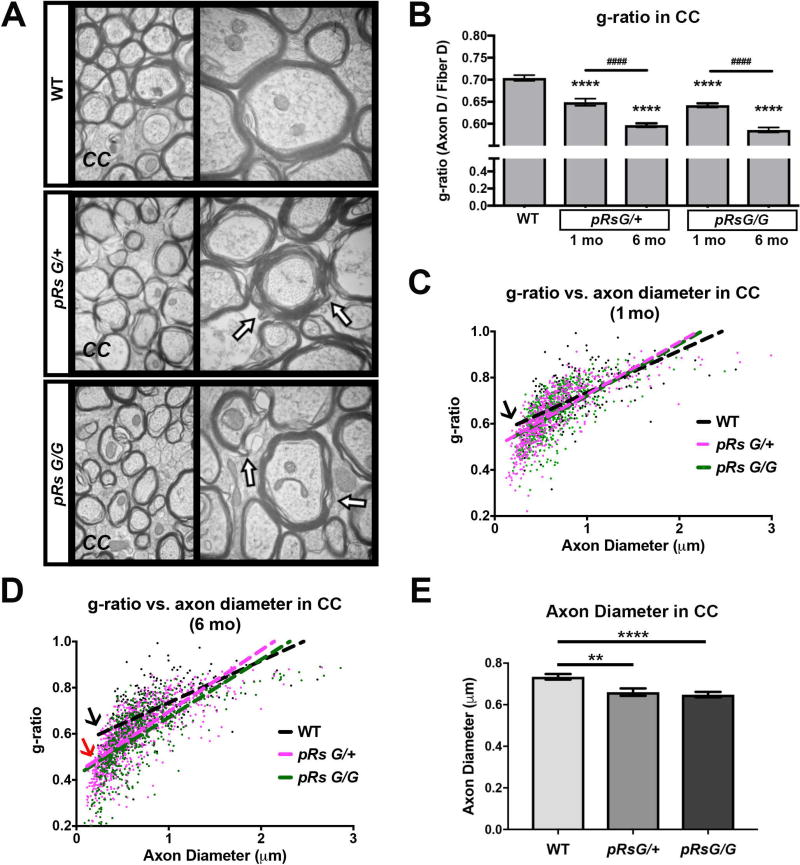
FIGURE 2. HRas hyperactivation in mature oligodendrocytes decreases g-ratio.
A: Electron micrographs of myelinated axons in the corpus callosum (CC) at the midline of WT, pRsG/+, and pRsG/G mice 1 month after tamoxifen treatment. High magnifications (50,000×) are shown at right; regions with myelin decompaction (See also figure 3A) are indicated with arrows. B: Analysis of only myelinated axons indicates decreased g-ratio in pRsG/+ and pRsG/G mutants at 1 month (1mo, n= 3 mice per genotype) and 6 months (6mo, pRsG/+ mice; n= 5, pRsG/G mice; n= 3 mice) post-tamoxifen (****p<0.0001), as compared to g-ratio in WT mice (n= 6 mice). The g-ratio was further decreased in pRsG/+ and pRsG/G mutants at 6 months post-tamoxifen, as compared to pRsG/+ and pRsG/G mice 1 month after tamoxifen (####p<0.0001), respectively. C–D: Scatterplots and linear regression of the axon diameter vs. g-ratio from myelinated fibers in WT (black), pRsG/+ (pink), and pRsG/G (green) mice, 1 month (C) and 6 months (D) after tamoxifen treatment. The slopes of g-ratio vs. axon diameter are similar in HRas mutants compared to WT mice at 1 mo (C, black arrow); however, small g-ratio in HRas mutants is associated to small diameter axons at 6 mo (D, black arrow vs. red arrow). E: Evaluation of the diameter of myelinated axons shows significant decreases in pRsG/+ (n= 3 mice, **p=0.001) and pRsG/G (n= 3 mice, ****p<0.0001) 1 month after tamoxifen treatment, as compared to WT mice. One way ANOVA and Tukey’s multiple comparisons test was used in the analyses. All data are presented as the mean ± s.e.m.

