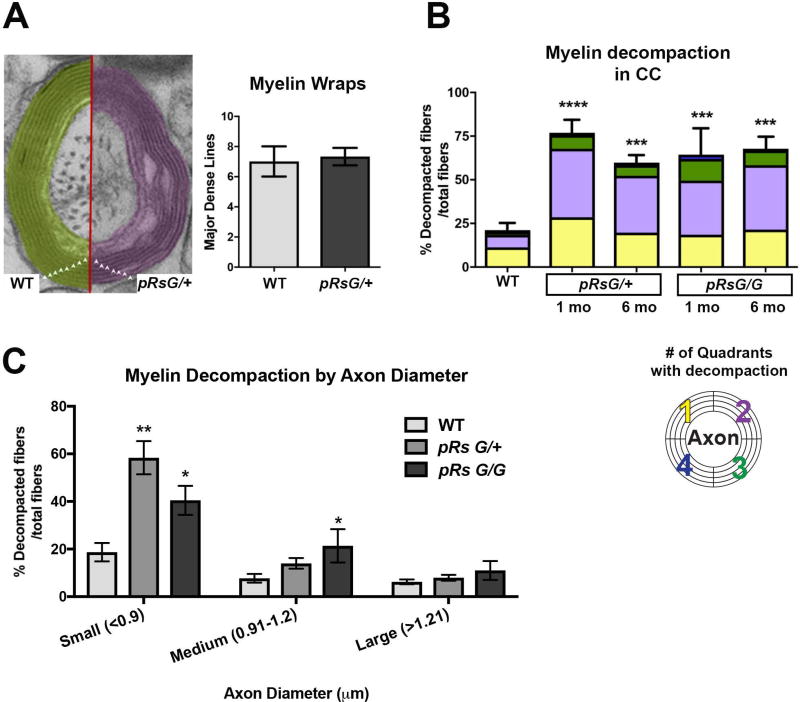
FIGURE 3. HRas hyperactivation in mature oligodendrocytes causes myelin decompaction.
A: Left: Representative image of the number of myelin lamellae (triangles) wrapping an axon in WT and pRsG/+ mice. Right: quantitative analysis indicates no significant changes in the number of myelin wraps between WT and pRsG/+ mice (unpaired t test, p=0.64). B: Analysis of myelinated axons indicates significantly increased percent of fibers with myelin decompaction in pRsG/+ mutants at 1 month (1 mo, n= 3 mice, ****p=0.0001) and 6 months (6 mo, n= 5 mice, ***p=0.0006) post-tamoxifen, compared to WT mice (n= 3 mice). Myelin decompaction was also observed in pRsG/G mutants at 1 mo (n= 3 mice, ***p=0.0009) and 6 mo (n= 3 mice, ***p=0.0005) post-tamoxifen, as compared to WT mice. No significant changes were observed among different time points in both pRsG12V mutants. The percent of fibers showing decompaction in 1–4 quadrants (color code; bottom) is shown within the total fibers with decompaction, as a reference for severity of the phenotype. C: Significantly increased percent of decompacted myelin was detected in fibers containing small axons (<0.9 µm, n= 3 mice, **p=0.001) in pRsG/+ mutants, and small (n= 3 mice, *p=0.037) and medium (0.91–1.2 µm, n= 3 mice, *p=0.048) axons of in pRsG/G mutants 1 month post-tamoxifen, as compared to WT mice (n= 6 mice). One way ANOVA and Tukey’s multiple comparisons test was used in all analyses, except in panel A (Student’s t test). All data are presented as the mean ± s.e.m.

