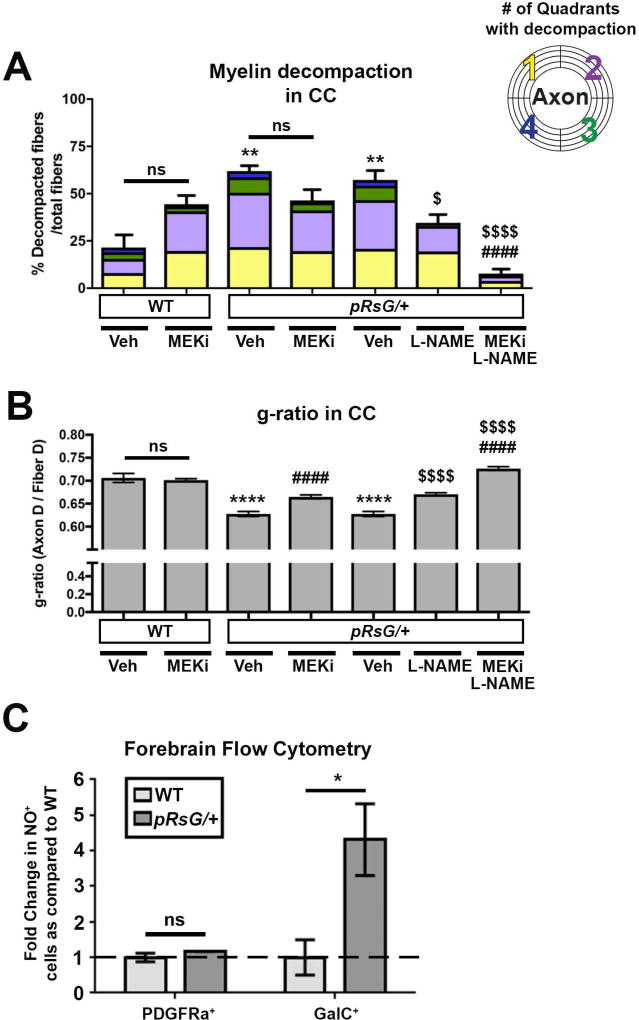
FIGURE 4. Myelin defects in pRsG/+ mutants are susceptible to MEK and NOS pharmacological inhibition.
A: Quantification of total fibers with myelin decompaction, and quadrants with decompaction (color code), in WT and pRsG/+ mutants subjected to the indicated pharmacological treatments 1 month post-tamoxifen. No significant changes (but a trend toward increase) are observed in the percent of decompacted fibers in MEK inhibitor (MEKi)-treated WT (n= 6), as compared to vehicle-treated WT mice (n= 3, ns: not significant, p=0.219). Vehicle-treated pRsG/+ mutants (n= 3) show increased myelin decompaction, as compared to vehicle-treated WT mice (methocel for MEKi; **p=0.002 and PBS for L-NAME; **p=0.003). No significant changes (but a trend toward decrease) were observed in decompaction in pRsG/+ mutants treated with MEKi (n= 3 mice), as compared to vehicle-treated mutants (ns, p=0.261). Significantly decreased percent of decompacted fibers were observed in pRsG/+ mutants treated with L-NAME (n= 4 mice, $p=0.030), and myelin compaction was fully rescued to WT levels by concomitant treatment with L-NAME and MEKi, as compared to vehicle-treated mutants (n= 4 mice, ####,$$$$p<.0001). B: The g-ratio comparison of WT and pRsG/+ mutants subjected to the indicated pharmacological treatments 1 month post-tamoxifen (same cohort of mice as in panel A). No significant changes were observed in g-ratio of vehicle-treated vs. MEKi-treated WT mice (ns, p=0.996). Vehicle-treated pRsG/+ mutants show decreased g-ratio, as compared to WT mice (PBS or methocel ****p<0.0001). Significantly increased g-ratio was observed in pRsG/+ mutants treated with MEKi (####p<0.0001) or L-NAME ($$$$p<0.0001), as compared to vehicle-treated mutants, respectively. Furthermore, increased g-ratio was observed in pRsG/+ mutants concomitantly treated with MEK and L-NAME (####,$$$$p<0.0001). C: Flow cytometry analysis of forebrain cells indicates no change in the number of PDGFRa+ OL precursors showing Nitric Oxide (NO) signals (ns, p=0.225); however, the number of GalC+;NO+ mOLs are significantly increased in pRsG/+ mutants (n= 3 mice, t test, *p=0.042), as compared to WT mice (n= 3 mice). Data are presented as the mean ± s.e.m. One-way ANOVA and Tukey's multiple comparisons test were used in all panels, except in C.

