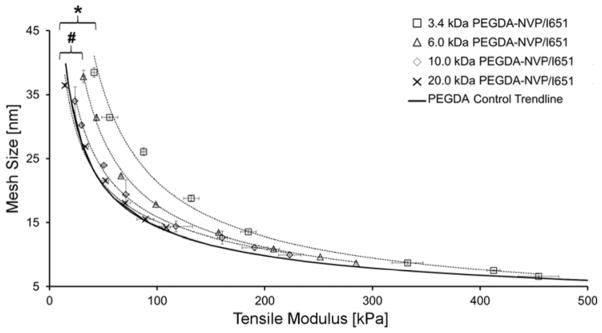
Figure 3.
Influence of NVP on the E-ξ curves for PEGDA-NVP hydrogels of varying PEGDA Mn and concentration. Data values are reported as average ± standard deviation for n = 4–8 independent samples per formulation. An asterisk indicates significant differences between the 3.4 kDa PEGDA-NVP/I651 and the PEGDA control trend line (p < 0.001), while a pound symbol indicates significant differences between 6.0 kDa PEGDA-NVP/I651 and the PEGDA control trendline (p < 0.001).

