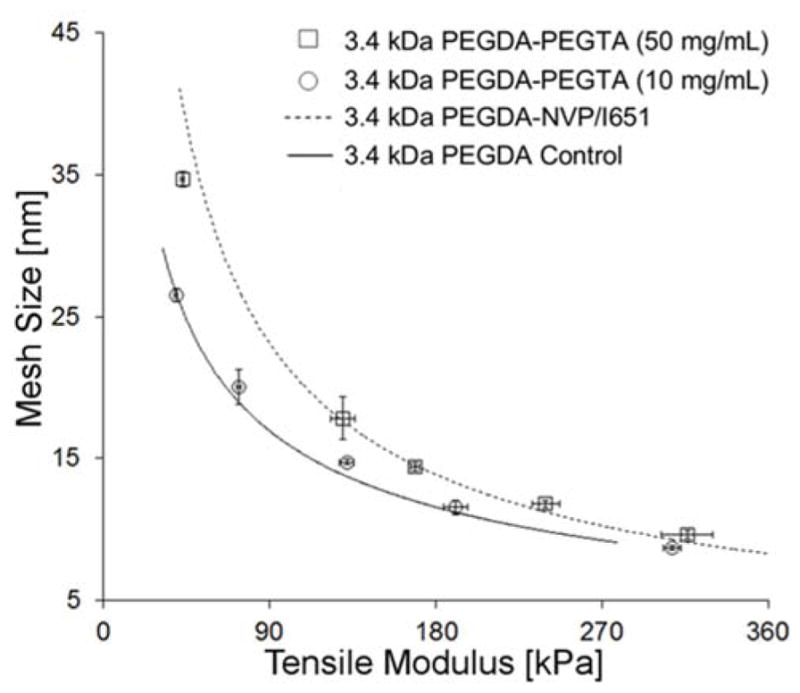
Figure 7.

Effect of the incorporation of PEGTA on the E-ξ curve for the 3.4 kDa PEGDA hydrogel series. Note that the 3.4 kDa PEGDA-PEGTA (50 mg/ml) data points overlay onto the line-fit for the E-ξ curve for PEGDA-1×NVP/I651 data, whereas the 3.4 kDa PEGDA-PEGTA (10 mg/ml) data points overlay onto the line-fit for the E-ξ curve for the 3.4 kDa PEGDA control hydrogels. Data values are reported as average ± standard deviation for n = 4 independent samples per formulation.
