Figure 5.
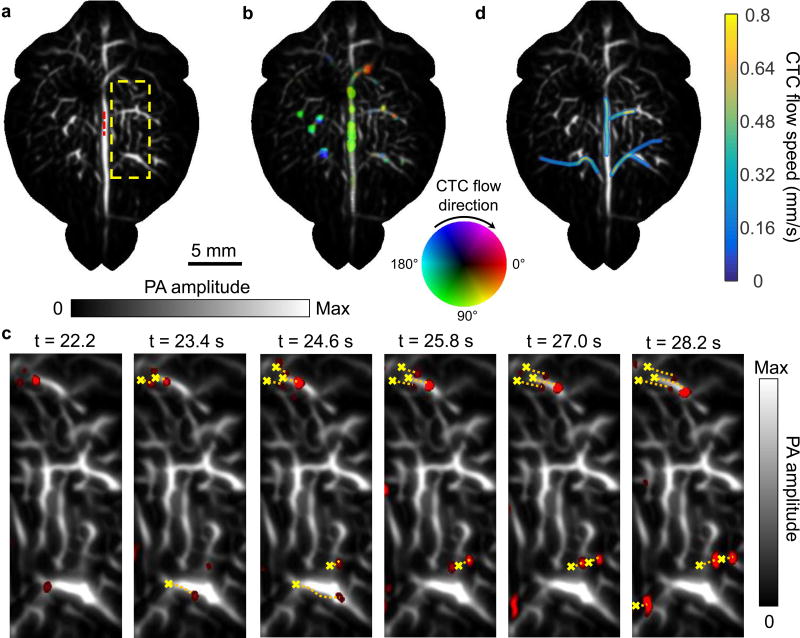
Label-free tracking of CTCs in the mouse brain in vivo (Supplementary Video 11). (a) Baseline cortical vasculature before the injection of melanoma cancer cells, under 680-nm excitation. (b) PA imaging of the mouse cortex after injection of melanoma cancer cells, where colors represent CTCs’ flow direction. Flow speed is radially encoded in the color disk by hue saturation (a greater radius indicates faster) (c) Tracking the flowing of cancer cells, where red highlights the moving cancer cells in the current frame, yellow crosses show their initial positions, and the orange dashed lines represent the CTCs’ flowing traces. (d) Flow speed distribution of CTCs in segmented cortical vessels.

