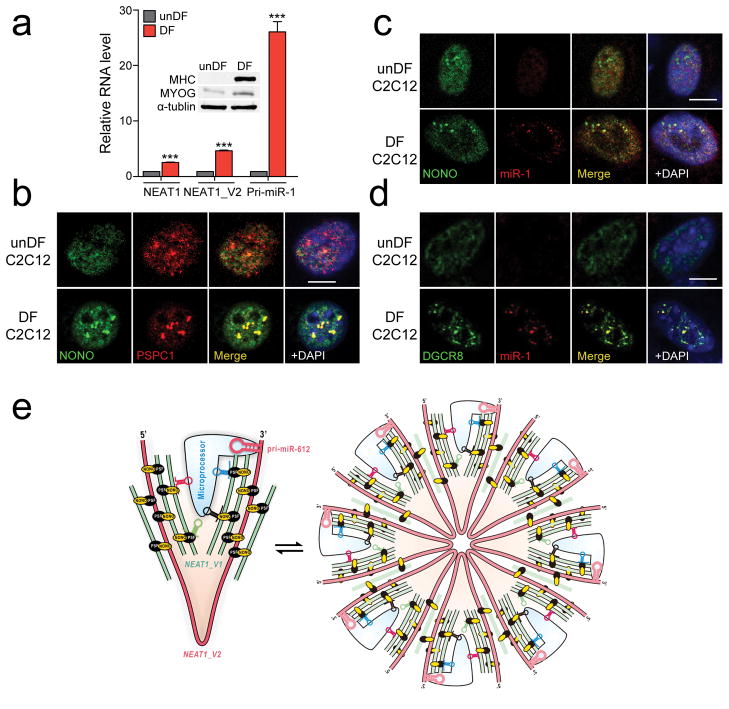
Fig. 6. Localization of induced pri-miR-1 in paraspeckles in differentiated C2C12 cells and the proposed bird nest model.
(a) The expression levels of NEAT1 and pri-miR-1 quantified by RT-qPCR in undifferentiated (unDF) and differentiated (DF) C2C12 cells. Inset shows the induction of the differentiation marker MHC and MYOG by Western blotting. (b) Enhanced paraspeckles after C2C12 differentiation, detected by NONO immunostaining. (c) FISH analysis of inducible pri-miR-1. No pri-miR-1 signal was detectable in C2C12 cells before differentiation and colocalization of induced pri-miR-1 with NONO on paraspeckles in differentiated C2C12 cells. (d) Colocalization of induced pri-miR-1 with DGCR8 in differentiated C2C12 cells. Scale bars in b,c,d: 10 μm. (e) The proposed bird nest model for NEAT1-orchestrated enhancement of pri-miRNA processing by the Microprocessor. Multiple RBPs, including the NONO-PSF heterodimer, extensively interact with NEAT1_V2, on which additional NEAT1_V1 and NEAT1_V2 may be added to build a bird nest-like structure. Various RBPs may also bring pri-miRNAs to the nest and various RNA secondary structures in NEAT1, including a poorly processed pri-miR-612 near the 3′ end of NEAT1_V2, may help recruit the Microprocessor. These NEAT1-containing RNPs may exist in both the microscopic form (left) and become “aggregated” to generate larger structures visible as paraspeckles (right). In both forms, such RNA-orchestrated structures may create the proximity between pri-miRNAs and the Microprocessor to enhance the kinetics of pri-miRNA processing. Bar graphs in a are presented as mean ± SEM (n=3, technical replicates). ***P < 0.001; NS, not significant, determined by two-tailed Student’s t test. Uncropped images of Western blots are shown in Supplementary Data Set 1 and data source for the bar graphs are reported in Source Data for Figure 6.

