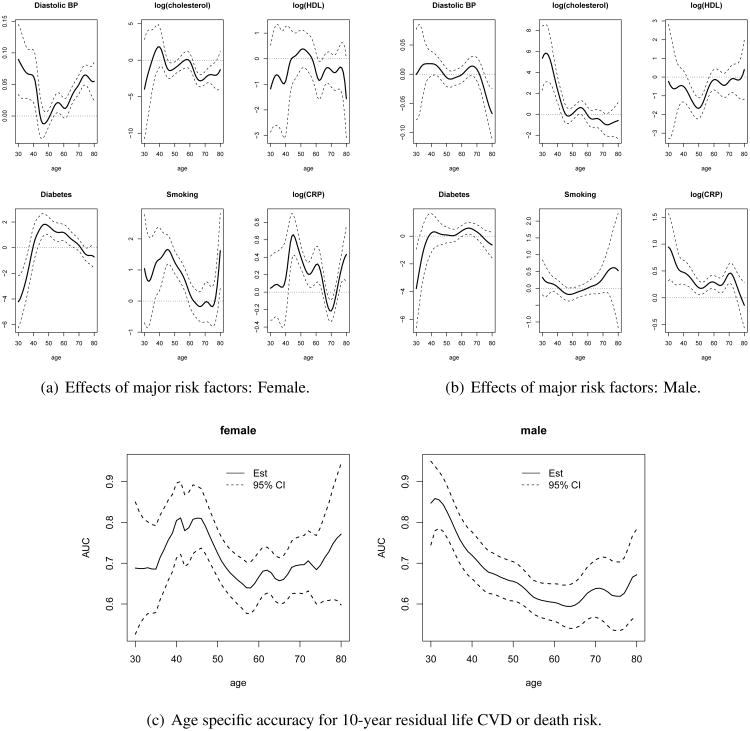
Figure 6.
Data analysis: Framingham Heart Study. The panels (a) and (b) show the point and interval estimates of the age-specific effects of the major risk factors for male and female, respectively. The panel (c) shows the point and interval estimates of the age-specific AUC for male and female respectively.

