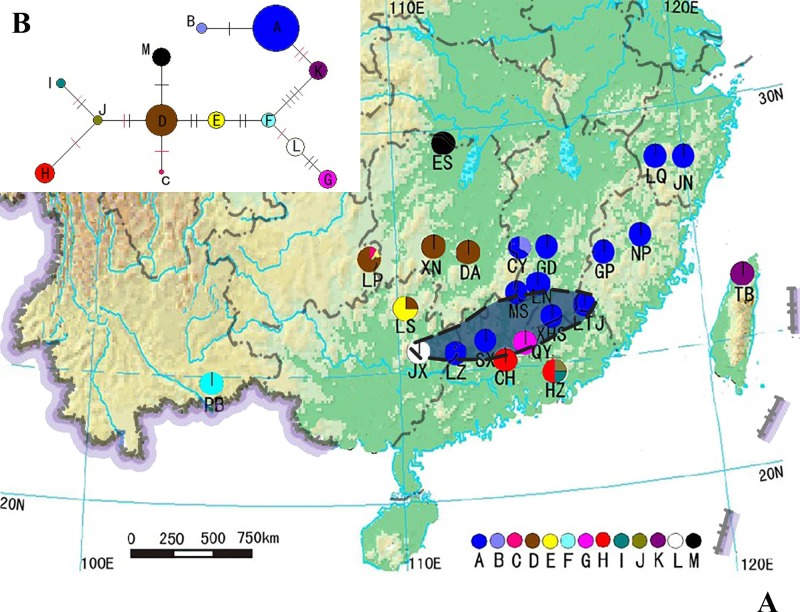
Fig 1.
Distribution (A) and network (B) of Bretschneidera sinensis haplotypes. (A) Distribution of 13 Bretschneidera sinensis haplotypes in China. Letters below the colorful circles in the map stand for the population names; different colorful circles are to distinguish the haplotypes (see Legend); the shadow area with dashed margin indicades the approximate coverage of Nanling Mtn. (B) Network of Bretschneidera sinensis haplotypes in China. Median-joining network of the 13 haplotypes of B. sinensis. Solid bars indicate the number of mutation steps, black bars represent parsimony sites, and red bars represent cpSSR variation. The size of circles reflects the frequency of haplotypes observed.

