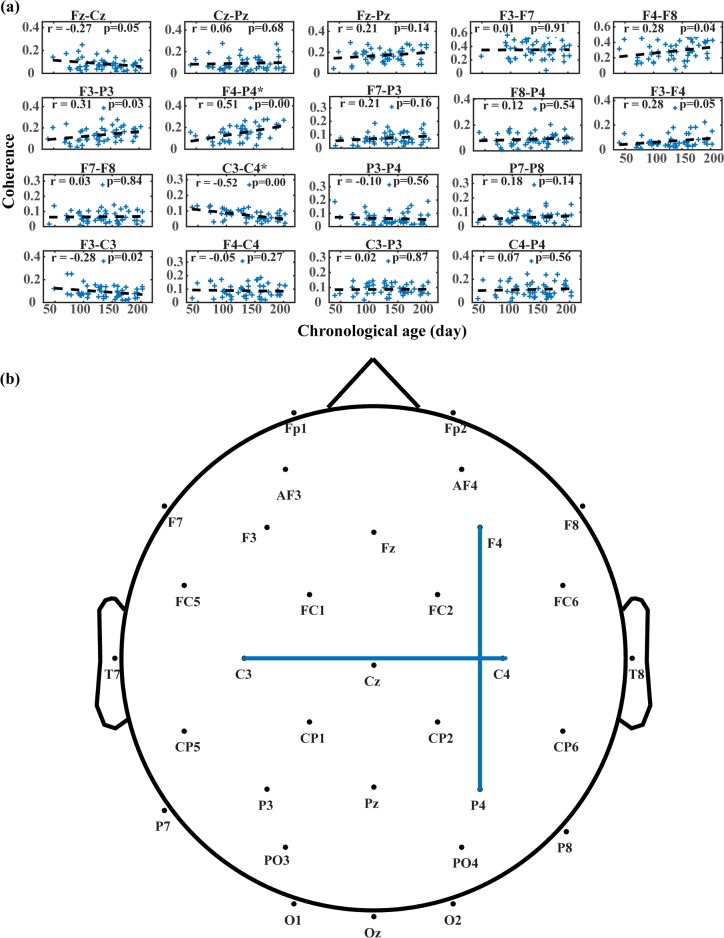
Fig 4. Changes in mean alpha coherence along maturation.
(A) Changing trends of mean alpha coherence for each electrode pair. In each subplot, blue crosses denote magnitudes of mean alpha coherence for all sessions, and dashed lines are the least-squares fitted lines. (B) Electrode pairs with significance in likelihood ratio tests. Electrode pairs with significance are connected with blue lines.

