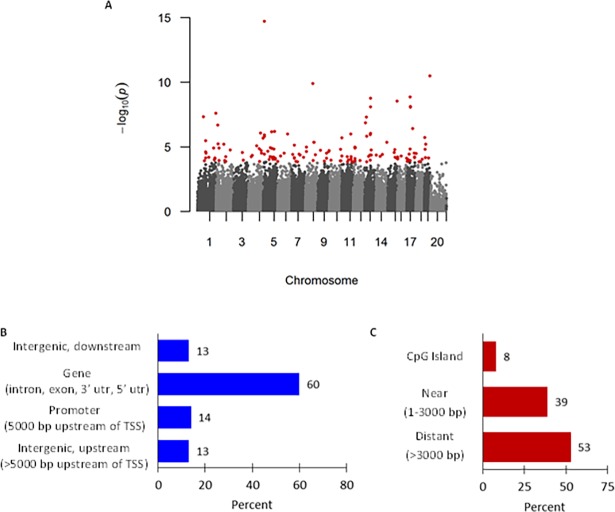
Fig 4. Loss of Mthfr activity in HDM-treated mice was associated with differential DNA methylation.
(A) Manhattan plot of the p-values from a weighted beta regression for HDM-treated C57BL/6Mthfr-/- vs. HDM-treated C57BL/6 mice. Each dot represents a p-value for correlating CpG clusters as identified through A-clustering with a minimum of 3 CpGs within a cluster. Red dots denote statistically significant differentially methylated regions (DMRs) after adjustment for multiple testing correction. Genomic distribution of 146 DMRs by relationship to (B) gene and (C) CpG Island.

