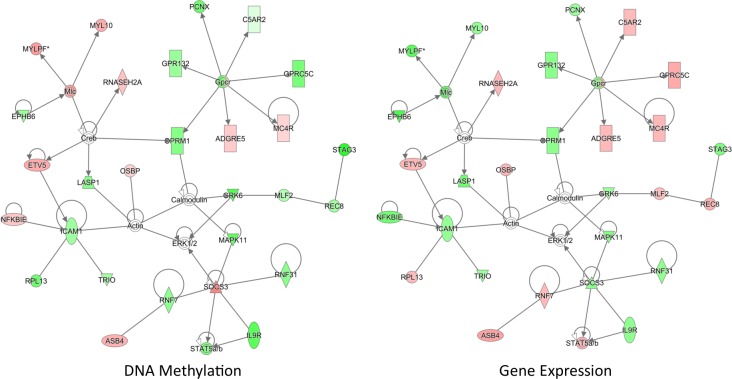
Fig 6. Network of methylation changes directly correlated with transcriptional activity.
Methylation changes directly correlated with transcriptional activity. Methylation-expression relationships were measured by beta regression of differentially methylated regions (DMRs, uncorrected p-value <0.05, n = 6,927) associated with HDM-treated C57BL/6Mthfr-/- mice and all expression probes found within 1Mb of each DMR. Ingenuity Pathway Analysis (IPA) on the 503 significant methylation-expression correlations (adjusted p-value <0.05) identified a significant inflammatory response network (score = 52). Green indicates lower methylation or expression and red indicates higher methylation or expression in HDM-treated C57BL/6Mthfr-/- mice. Methylation values are colored based on relative methylation change between HDM-treated C57BL/6Mthfr-/- and HDM-treated C57BL/6 mice; colors of expression values are based on fold change between HDM-treated C57BL/6Mthfr-/- and HDM-treated C57BL/6 mice. Molecule shapes: horizontal oval = transcriptional regulator; vertical oval = transmembrane receptor; diamond = enzyme; up triangle = phosphatase; down triangle = kinase; trapezoid = transporter; circle = other; double circle = group; rectangle = G-protein coupled receptor. This analysis was restricted to only direct relationships. The network score is based on the hypergeometric distribution, and is calculated with the right-tailed Fisher’s exact test to identify enrichment of correlated methylated/expressed genes in the network relative to IPA database. The other network with a score greater than 40 is shown in S5 Fig.

