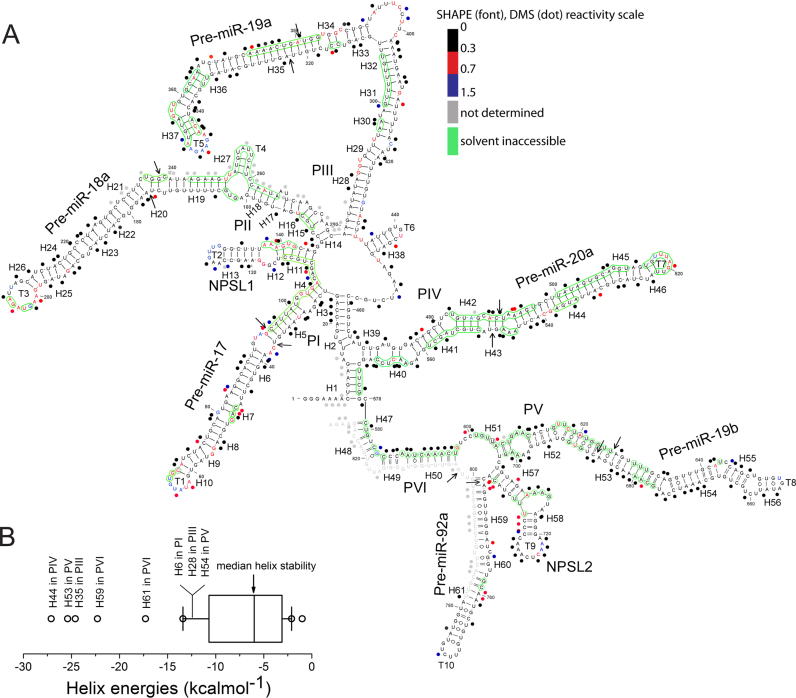
Figure 2.
SHAPE analysis of oncomiR-1. (A) SHAPE derived secondary structure model of oncomiR-1 cluster. The nucleotides are color coded according to SHAPE (font) and DMS (dot) reactivity. Solvent inaccessible nucleotides are shown in green circles. Pri-miRNA domains (P) and structural elements (H, helix; T, terminal loops) are indicated in the figure. Black arrows indicate Drosha cleavage sites. (B) Thermodynamic stability of all the helices constituting oncomiR-1 cluster. Free energy calculated using nearest neighbor analysis from the SHAPE derived model structure.

