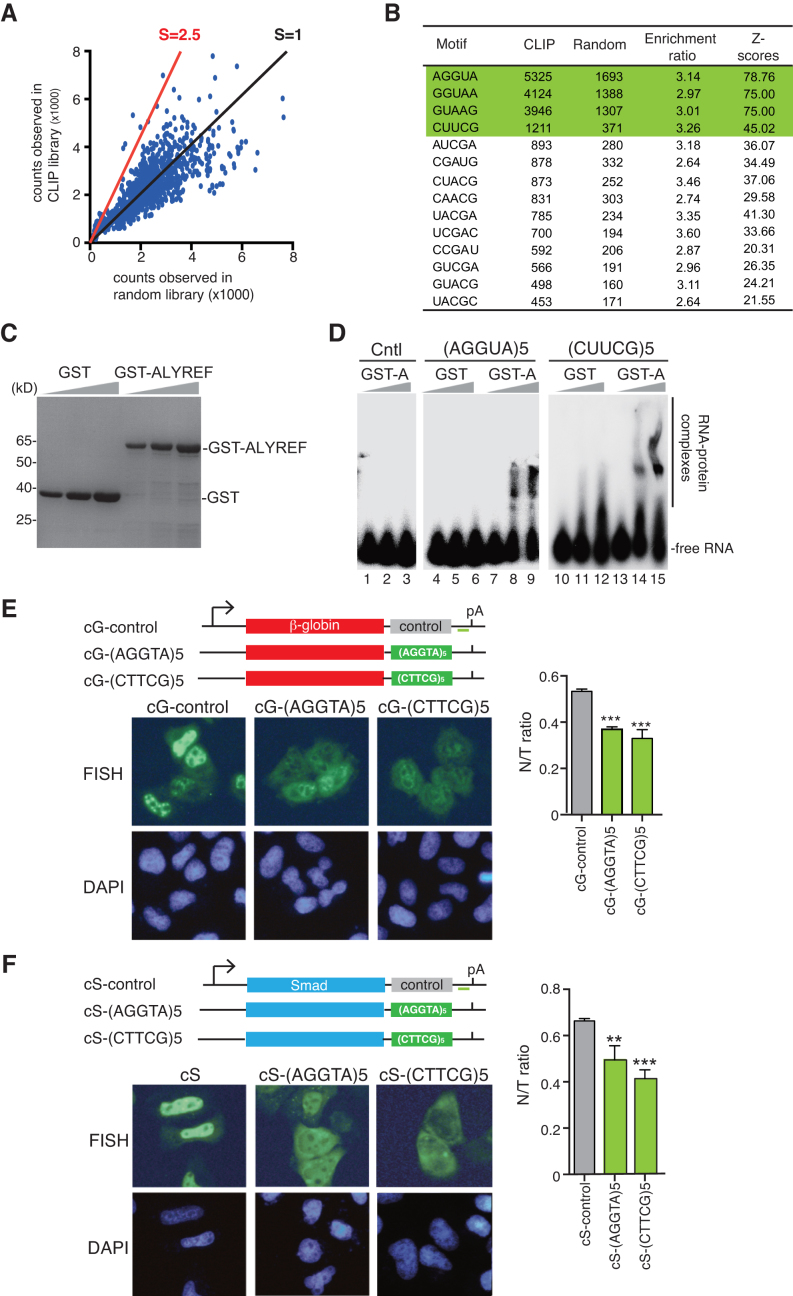
Figure 5.
Identification of functional ALYREF-binding motifs. (A) Analysis of ALYREF binding motif. The enrichment ratio of the occurrences in the ALYREF binding sites (occurrence in iCLIP library, vertical ordinate) to those in randomized binding site (occurrence in random library, horizontal ordinate) of each pentamer is shown. The red line indicates the position with the enrichment ratio of 2.5. Z-scores are used to evaluate statistical significance of enrichment of each motif. (B) The sequences of motifs with enrichment ratio bigger than 2.5. (C) Purified GST and GST-ALYREF used in EMSA were separated by SDS-PAGE, followed by Coomassie staining. (D) 0.1 pmol of 32P-labeled RNAs containing 5 tandems repeats of AGGUA or CUUCG were incubated with 0, 3 and 10 pmol of purified GST-ALYREF or GST. The protein–RNA complexes were fractionated on a 5% native-PAGE gel and visualized using autoradiography. The position of free RNAs and protein-bound RNAs are indicated. As another control, same amount of the RNA containing five tandem repeats of UAAAA was incubated with GST-ALYREF. (E) Schematic of the β-globin reporter constructs. The CMV promoter, BGH polyA sites and the location of the FISH probe (vector probe) that detects a region of pcDNA3 vector (indicated by a short green line) are shown. Tηεσε constructs were transfected into HeLa cells. 12 h after transfection, FISH was preformed to detect the indicated mRNAs. DAPI staining was used to indicate the nuclei. N/T ratios were determined for 30 cells per construct in each experiment. The graph shows the average N/T ratios from three independent experiments, and error bars indicate the standard deviations. Statistical analysis was performed using Student's t test. **P < 0.01; ***P < 0.001. (F) Same as (E), except that Smad DNA constructs were used.

