Figure 2.
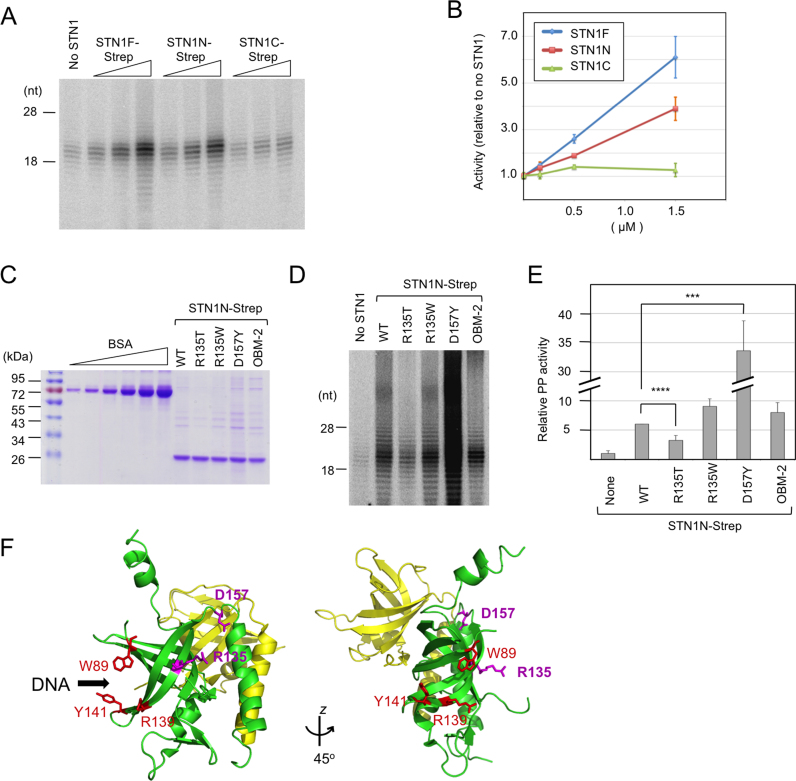
PP stimulation by STN1 variants. (A) Human PP (2 nM) was assayed using the poly-dT template in the presence of increasing concentrations (0.17, 0.5 and 1.5 μM) of STN1F, STN1N and STN1C. (B) Total signal for each sample in the 10–30 nt product size range as determined by assays shown in A were quantified from PhosphorImger scans, normalized against the signal for the ‘no STN1’ sample and plotted. Data (averages ± S.D.) are from three independent experiments. (C) Purified STN1N and the R135T, R135W, D157Y and OBM mutants were analyzed on 10% SDS-PAGE along with bovine serum albumin (BSA) standards (0.25, 0.5, 1.0, 2.0, 4.0 and 8.0 μg). (D) Human PP (1 nM) was assayed using the poly-dT template in the presence of wild-type or mutant STN1N (1.5 μM) as indicated. (E) The assays in D were repeated three times. The signals in each series of assays were normalized against the ‘STN1N WT’ sample and plotted (average ± S.E.M.). One unit was defined as the average activity of the ‘no STN1’ sample. Note that the bar for D157Y is compressed so that the differences between other STN1N variants are better visualized. P-values as determined by two-tailed t-test are designated by asterisks as follows: ***: 0.05 > P > 0.01; ****: 0.01 > P. (F) Using the crystal structure of STN1N–TEN1 complex as template (PDB ID: 4JOI), the STN1 residues mutated and analyzed in this study were mapped onto the STN1N OB fold using Pymol. Residues altered in the OBM-2 mutant (shown in red) fall on the presumed DNA binding surface of STN1 based on analogy with RPA2. In contrast, the residues mutated in Coats plus (R135 and D157Y) fall on a different face of STN1.

