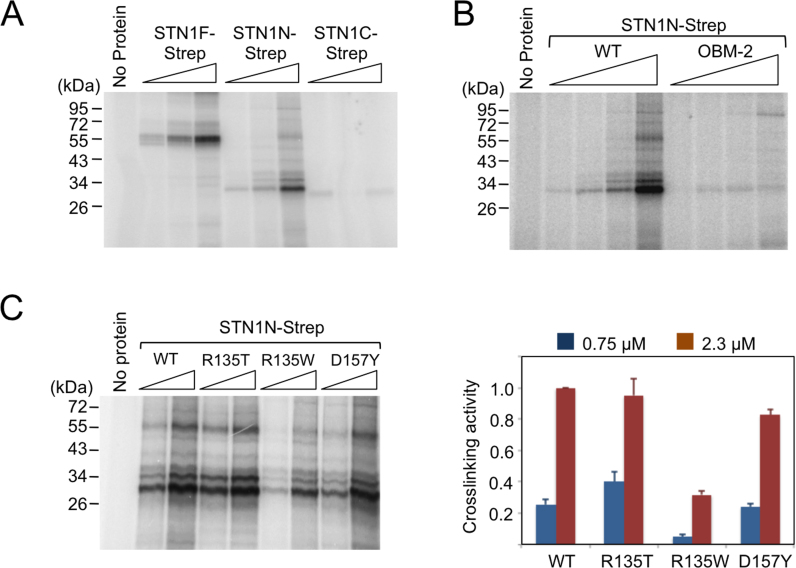
Figure 5.
STN1-DNA crosslinking. (A) Increasing concentrations of STN1F, STN1N and STN1C (0.25, 0.75, 2.3 μM) were mixed with 2 nM 5′-P32-labeled oligonucleotide containing a single Iodo-dU substitution, irradiated with UV and then analyzed by SDS-PAGE and PhosphorImager scanning. (B) Increasing concentrations (0.083, 0.25, 0.75 and 2.3 μM) of wild-type STN1N and the OBM mutant were subjected to the same DNA crosslinking assay. (C) Two different concentrations of wild-type STN1N and the indicated mutants (0.75 and 2.3 μM) were subjected to the same DNA crosslinking assay. A representative set of assays is shown on the left, and the data (averages ± S.D.) from three independent experiments are plotted on the right. One unit of activity is defined as that generated by 2.3 μM of the wild-type STN1N.

