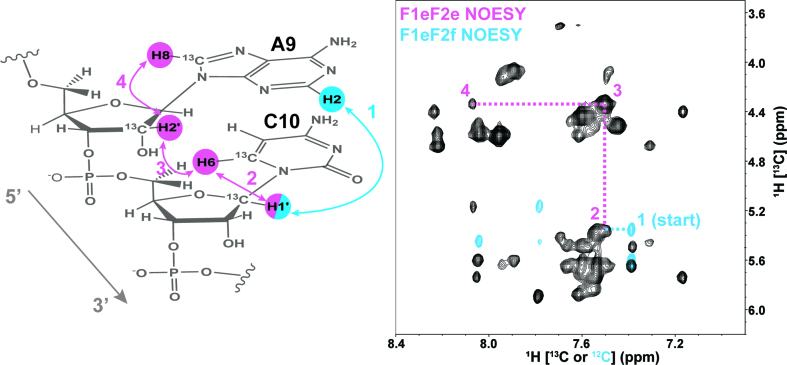
Figure 5.
The sequential NOESY ‘walk’ strategy for steps 1 and 2 is highlighted for the A9 and C10 stacked residues. All carbons are 12C labeled unless otherwise identified. The F1eF2f NOESY spectrum (sky blue peaks) is overlaid with the reddish purple F1eF2e NOESY region (black peaks) and includes the peaks labeled for each NOE connectivity (color coded and numbered to match NOESY spectrum) expected in the sequential A9-C10 example.

