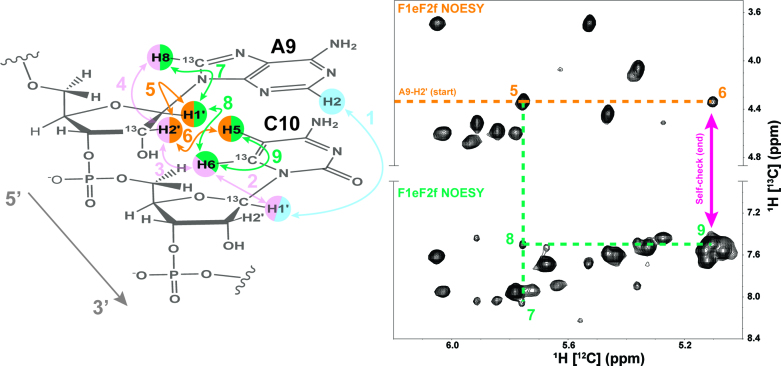
Figure 6.
The sequential NOESY ‘walk’ for Steps 3 and 4 are color coded and numbered to match the peaks in the F1eF2f NOESY spectrum regions. Previous assignment steps are faded within the A9-C10 example for visual reference. The A9-H2′ starting point is labeled and follows the dotted orange line to peaks 5 and 6. Extension of the A9-H1′ assignment is marked by the dotted bluish-green line to peaks 7 (A9-H8) and 8 (C10-H6). Peak 9 from the C10-H6 to C10-H5 serves as a self-check with peak 6 (magenta arrow).

