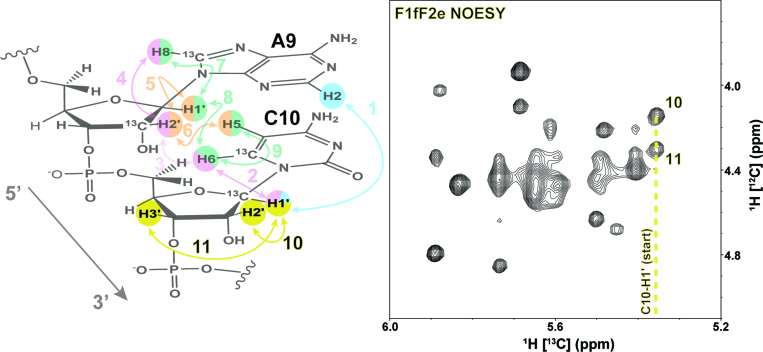
Figure 7.
A schematic of the final assignment steps for unlabeled H2′ and H3′ from Step 5 of the logical assignment process with yellow highlighted arrows and numbers. The previous assignment steps and protons are faded for visual reference. The F1fF2e NOESY (yellow region) with starting point (C10-H1′) and cross-peaks to C10-H2′ and C10-H3′ are labeled 10 and 11, respectively.

