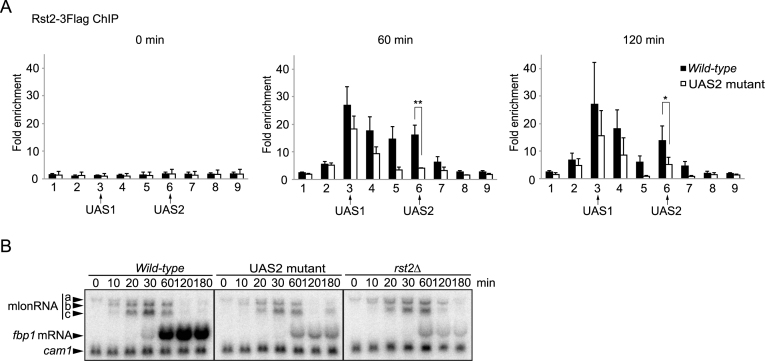
Figure 4.
Rst2-binding to UAS1 is preserved in UAS2-mutant cells. (A) The distribution of Rst2 was examined by ChIP analysis in wild-type and UAS2-mutant cells. Cell culture and ChIP analysis were performed as described in Figure 1. Error bars show the standard deviation from at least two independent experiments. Statistical significance (by Student's t-test) is as follows: *P < 0.05; **P < 0.01. (B) Northern blot to detect fbp1 transcripts in wild-type, UAS2 mutant and rst2Δ cells. Cells were cultured as in Figure 1. Cells were harvested at the indicated times after glucose starvation. cam1 transcript was used as an internal control (54).

