Figure 3.
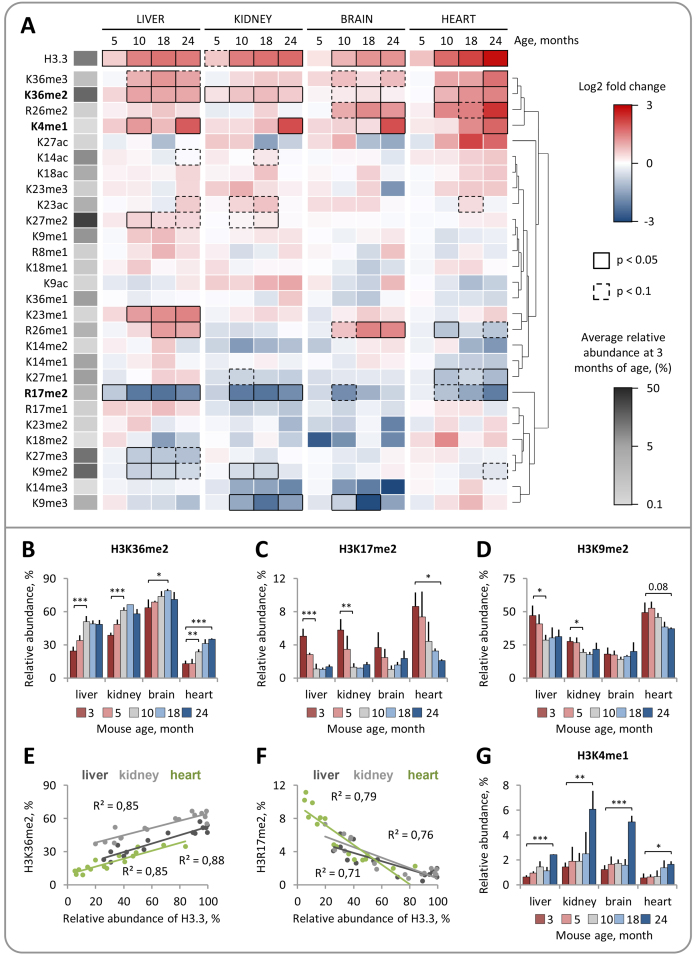
Middle-down mass spectrometry reveals distinct, dynamic changes in the relative abundances of individual H3 PTMs during mouse lifespan. (A) Dynamic changes in H3 PTM abundances in somatic mouse tissues with age (3–24 months). The heat map shows hierarchical clustering of the log2 transformed fold changes in H3 PTM abundances at indicated time points relative to those at 3 months of age. Significantly up- and down-regulated PTMs (Limma test with Benjamini-Hochberg correction for multiple comparisons) are indicated by black boxes (continuous line for P < 0.05; dashed line for P < 0.1) as shown in the color key. (B–D) Relative abundances of H3 PTMs that demonstrated a similar pattern of change with age in different tissues. The level of H3K36me2 increases during the adulthood (months 3–10) (B) and correlates with the relative abundance of H3.3 (E). The level of H3R17me2 decreases during the adulthood (months 3–10) (C) and correlates with the relative abundance of H3.3 (F). The level of H3K9me2 decreases during the adulthood (months 3–10) in liver and kidney tissues (D). H3K4me1 is upregulated in tissues derived from 24-month-old mice (G). Error bars indicate SD (n = 2–4 biological replicates).

