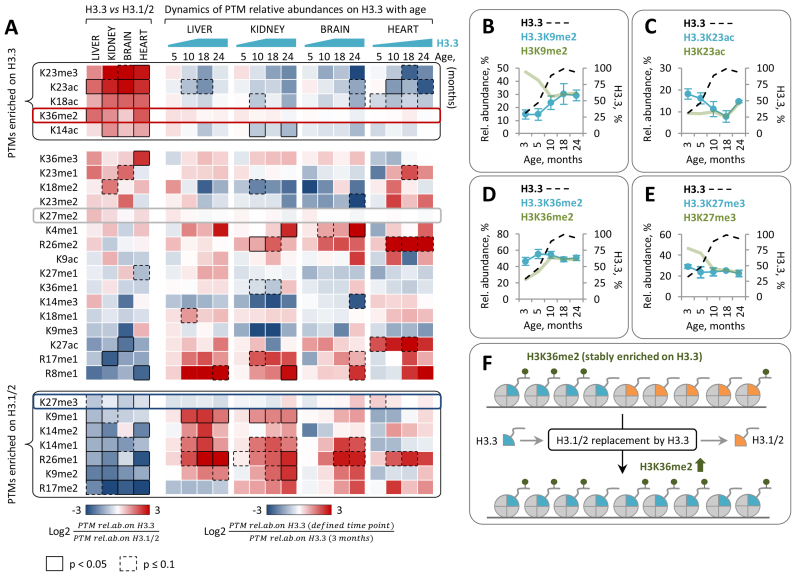
Figure 5.
Relative abundances of PTMs on H3.3 exhibit distinct pattern of change with age. (A) Left panel: the heat map shows the difference in the relative abundances of PTMs between H3.3 and H3.1/2 isoforms in tissues derived from 3-month-old mice. Differentially abundant PTMs (paired t-test with Benjamini-Hochberg correction for multiple comparisons) are indicated by black boxes (continuous line for P < 0.05; dashed line for P < 0.1) as shown in the color key. Right panel: the heat map shows the log2 fold change in the relative abundances of PTMs on H3.3 at the indicated time points as compared to those at 3 months of age. Data shown in (B–E) are for liver tissue. (B) Relative abundance of H3.3K9me2 increases with age consistently with an accumulation of H3.3. (C) Relative abundance of H3.3K23ac decreases with age consistently with an accumulation of H3.3. (D–E) Relative abundances of H3.3K36me2 (D) and H3.3K27me3 (E) remain stable independently of mouse age and H3.3 relative abundance. For H3.3 PTM dynamics in kidney, brain and heart tissues see Supplementary Figure S6. (F) A putative model illustrating the causal relation between H3 variant replacement with age and increase in the global level of H3K36me2.

