Figure 6.
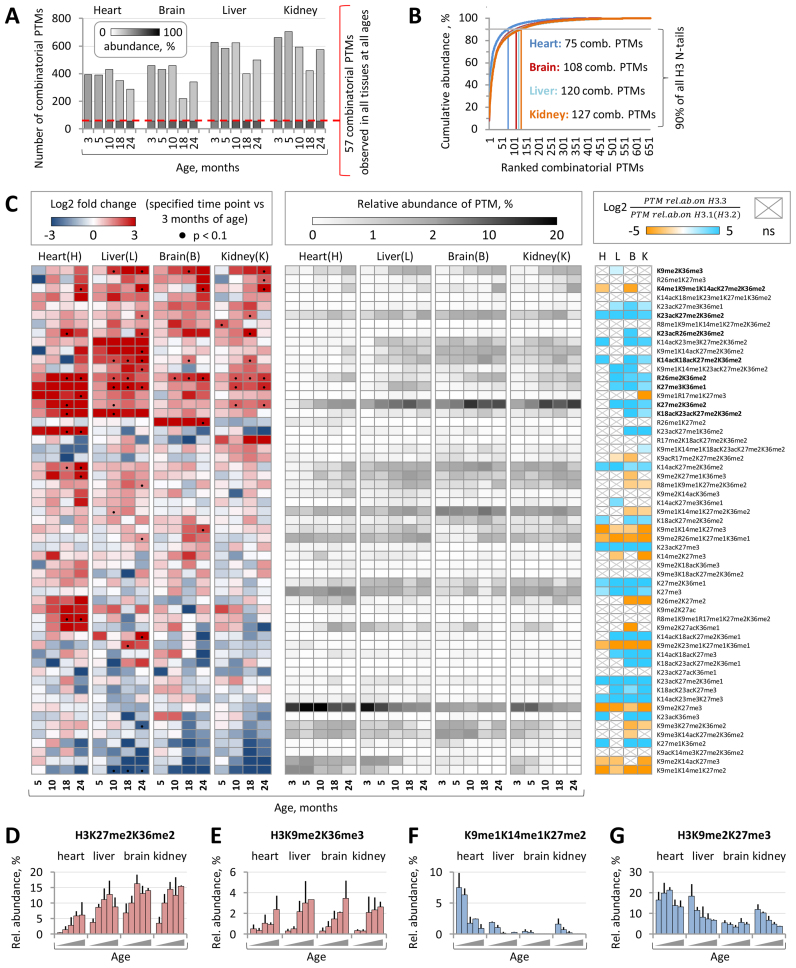
Combinatorial H3 PTM landscape undergoes dynamic changes with age. (A) The total numbers of distinct combinatorial H3 PTMs identified and quantified by the middle-down MS in four mouse tissues at the five indicated time points. 57 combinatorial PTMs were reproducibly detected in all biological samples. Relative abundances of H3 proteins marked by one of the 57 common or by one of remaining PTMs in each sample are indicated by grayscale shading as shown in the color key. (B) The cumulative relative abundance of combinatorial H3 PTMs ranked according to their abundance. (C) Left panel: the heat map shows the log2 fold change in relative abundances of 57 common combinatorial PTMs at the indicated time points as compared to those at 3 months of age. Statistically significant differences (P < 0.1, Limma test with Benjamini-Hochberg correction for multiple comparisons) are indicated by black dots. Central panel: the heat map shows the relative abundances of 57 common H3 combinatorial PTMs at the indicated time points. Right panel: the heat map shows the difference in average relative abundance of 57 common H3 combinatorial PTMs between H3.3 and H3.1/2 isoforms in tissues derived from 3- and 5-month-old mice. H3.3- and H3.1/2-enriched PTMs (P < 0.05, paired t-test with Benjamini–Hochberg correction for multiple comparisons) are shown in cyan and orange, respectively; non-significant differences are indicated by gray crosses. Relative abundances of H3K27me2K36me2 (D) and H3K9me2K36me3 (E) increase with age in all analyzed tissues, while the relative abundance of H3K9me1K14me1K27me2. (F) decreases with age. The relative abundance of H3K9me2K27me3 (G) decreases in liver and kidney chromatin.

