Figure 7.
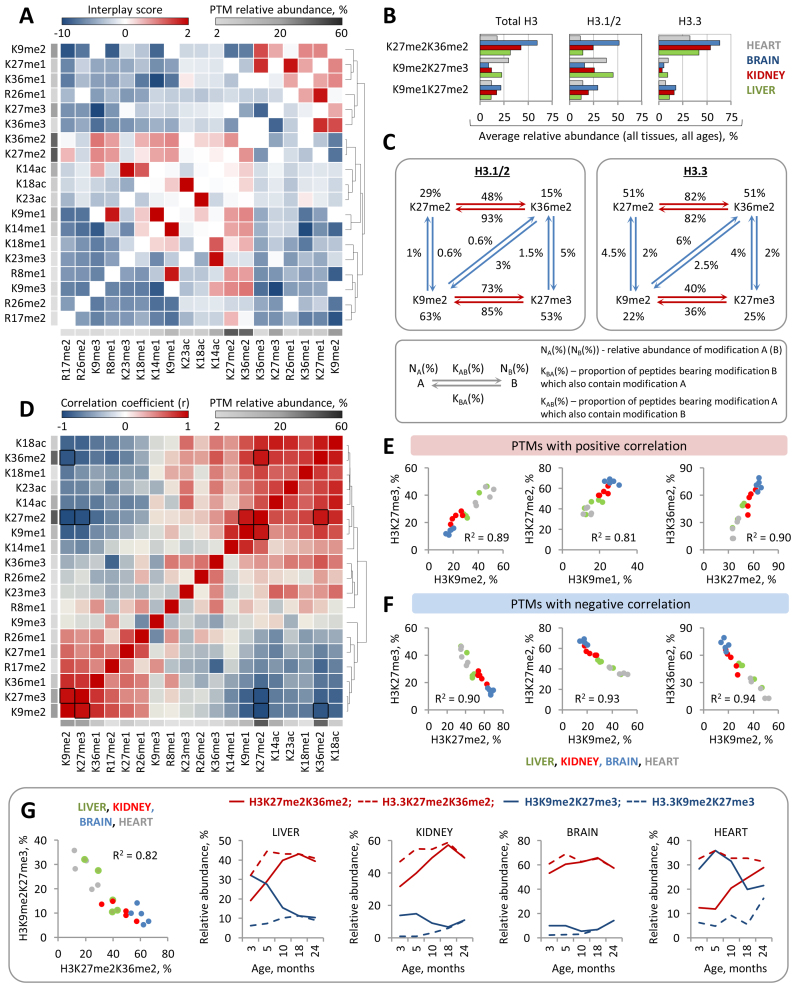
Analysis of histone modification crosstalk reveals a strong correlation between global levels of H3 methyl marks. (A) The heat map shows hierarchical clustering of interplay scores between H3 N-terminal PTMs. PTMs that tend to colocalize together (positive interplay values) or demonstrate mutually exclusive profile (negative interplay values) are indicated by red and blue colors, respectively; the average PTMs abundances are indicated by grayscale shading as shown in the color key. (B) Co-existence frequencies of the top three most abundant binary PTMs on total H3 and their co-existence frequencies on H3.3 and H3.1/2. (C) The scheme depicts a co-occurrence network between individual H3 PTMs involved in the top two most abundant binary PTMs specified in (B). (D) The heat map shows hierarchical clustering of Pearson's correlation coefficients between relative abundances of H3 N-terminal PTMs among all analyzed histone samples. Positive and negative correlations are indicated by red and blue colors, respectively, as shown in the color key; Pairs with strong correlation (|R| > 0.9) are outlined by black boxes. The average PTM abundances are shown as in (A). (E) Scatter plots highlight pairs of H3 PTMs whose relative abundances exhibit strong positive or negative (F) correlation. (G) Relative abundances of the two binary PTMs, H3K9me2K27me3 and H3K27me2K36me2, exhibit strong negative correlation, indicating the mutually exclusive relation between them. In line with the distinct stable levels of H3K9me2K27me3 and H3K27me2K36me2 on H3.3 and H3.1/2, H3 variant replacement with age is associated with profound changes in the global levels of these binary PTMs.

