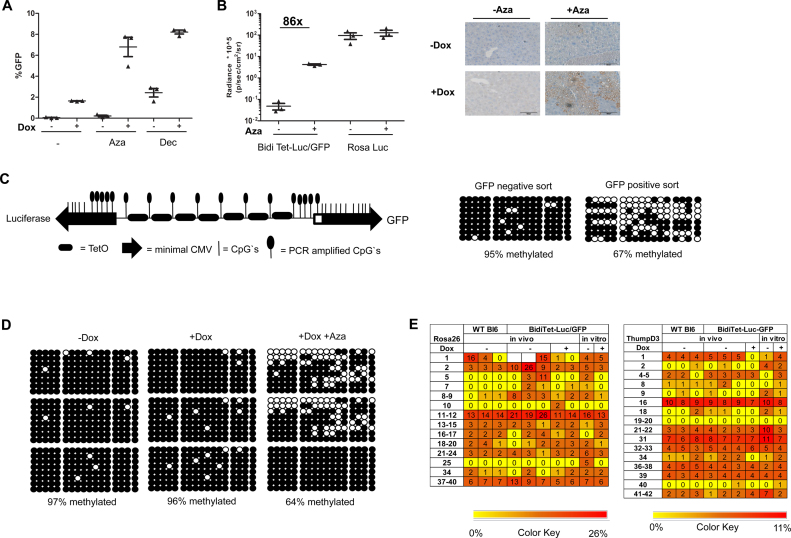
Figure 2.
The bidirectional Tet promoter is methylated in the ROSA26 locus and can be reactivated by DNMTi (A) GFP expression in BidiTet-Luc/GFP ES cells upon cultivation in presence of the DNMTis Decitabine and Azacytidine. BidiTet-Luc/GFP ES cells were cultivated in presence or absence of Doxycycline and Decitabine or Azacytidine for three days and subsequently subjected to flow cytometry. The percentage of GFP expressing cells is depicted. (B) In vivo imaging of induced BidiTet-Luc/GFP mice upon treatment with Azacytidine. Whole body bioluminescence was determined in three independent animals before and three days after the first treatment with Azacytidine. As control, Rosa-Luc animals were used. The bioluminescence of three independent mice per group is depicted on the left. On day 3, the liver was isolated and slices were stained for GFP expression. Depicted are representative sections from mice of the indicated groups. (C) Schematic depiction of the bidirectional Tet promoter in BidiTet-Luc/GFP cells and the position of the CpG's. The bidirectional Tet promoter comprises 30 CpGs, 8 CpG's flank the tetO sequences, 3 CpGs are located in a spacer element and the remaining 19 CpG are in the two opposing CMV promoter sequences. The location of the CpGs within the promoter (lines) and within the amplified PCR fragment (lollipops) are indicated. Note that the 5′ minimal CMV promoter is slightly shorter than the 3′ CMV promoter (72). (D) Methylation status of the Tet promoter in BidiTet-Luc/GFP ES cells. Cells were treated for 3 days with Decitabine. GFP positive and negative cells were sorted, DNA was extracted and subjected to bisulfite analysis. Subsequently, the Tet promoter DNA was PCR amplified and cloned in E. coli. Sequences of eight randomly picked clones representing eight independent cells are depicted. In each line, the circles depict the 17 CpGs of an individual clone/cell. Black circles indicate methylated cytosines and non-filled circles non-methylated cytosines. (E) Methylation status of Tet promoter in BidiTet-Luc/GFP mice. Bisulfite analysis of the Tet promoter based on DNA extracted from mouse livers. The methylation status of the Tet promoter in the non-induced (–Dox), induced (+Dox) and Azacytidine/Dox induced animals (+Dox +Aza) is depicted. Three independent mice per group were analysed. For each mouse, eight independent cells were sequenced and analysed. Black circles indicate methylated cytosines and non-filled circles non methylated cytosines. (F) Epityper based DNA methylation analysis of the ROSA26 and ThumpD3 promoter in cells and mice. The heat maps represent the results of the methylation analysis done on Epityper. The various CpG motifs of the two promoters are indicated on the x-axis of each map and the samples used are indicated on the y-axis. The reference scale is indicated (0.01 = 1% methylation and 0.26 = 26% methylation). Each vertical column represents the same CpG motif analyzed from different gDNA samples while each row represents the different CpGs within the same sample.

