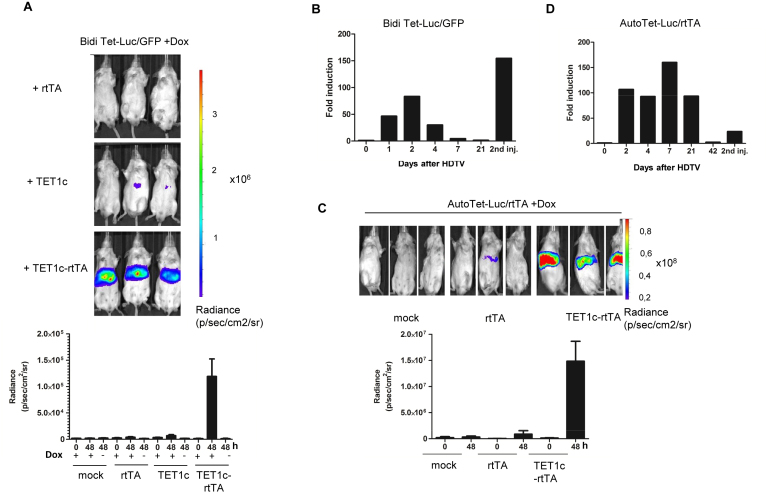
Figure 4.
Reversion of Tet-promoter silencing in vivo. (A) Reactivation of silenced gene expression in vivo. BidiTet-Luc/GFP mice were subjected to HDTV using the indicated plasmid DNA. As negative control the animals were hydrodynamically injected with PBS (mock). After 48 h, bioluminescence was measured by in vivo imaging. Doxycycline feeding was started 7 days before the experiment and was maintained throughout the experiment (upper panel). Control groups were measured in absence of Doxycycline as indicated. Representative in vivo images of mice as well as cumulative data from 5 independent animals per group are shown (lower panel). (B) Kinetics of reactivation. Bioluminescence of BidiTet-Luc/GFP animals was monitored on the indicated days after HDTV injection as described in (A). On day 21, HDTV injection was repeated using the same plasmid DNA and animals were imaged one day later. Bars represent measurement of four animals. The fold induction is related the bioluminescence signal before HDTV injection. Day 2 luciferase measurements were derived from the experiment represented in (A). (C) Reactivation of silenced expression in AutoTet-Luc/rtTA mice. Doxycycline induced AutoTet-Luc/rtTA mice received TET1c-rtTA, rtTA or PBS (mock) via HDTV injection. Bioluminescence of mice 48 h after HDTV injection is depicted on the left. The quantification of bioluminescence before (0) and 48 h after (48) based on three independent animals is depicted in the lower panel. As negative control (mock) AutoTet-Luc/rtTA animals were injected with PBS. (D) Kinetics of reactivation in AutoTet-Luc/rtTA mice. Bioluminescence of AutoTet-Luc/rtTA mice of (C) was monitored on the indicated days after HDTV injection. AutoTet-Luc/rtTA animals received drinking water supplemented with Doxycycline throughout the experiment. The animals were measured on the indicated days before and after HDTV injection. On day 42 HDTV injection was repeated using the same plasmid DNA and animals were analysed one day later. Bars represent measurement of three animals. Day 2 luciferase measurements are derived from the experiment represented in (C). The fold induction is related to the bioluminescence before HDTV injection.

