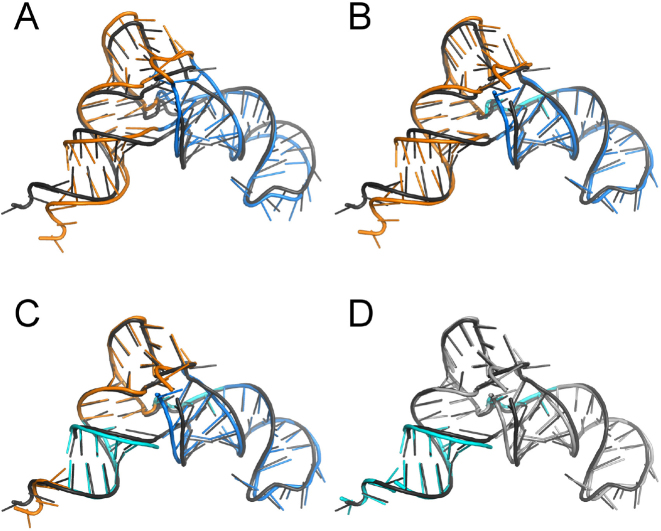
Figure 2.
Graphical illustration of the SupeRNAlign workflow, using as an example a pair of two tRNA(Asn) molecules (PDB code: 3KFU, reference structure shown in dark grey; and PDB code: 4WJ4, aligned structure shown in other colors). (A) First round: result of superposition of two RNA structures treated as rigid bodies; the aligned structure is then analyzed by ClaRNet and two substructures identified are colored blue and orange. (B) Second round: result of independent superposition of two fragments of the aligned structure identified by ClaRNet onto the corresponding fragments of the reference structure; a fragment identified as ‘well superimposed’ and frozen for further iterations is indicated in cyan, while the remaining fragments will continue being subjected to superposition. (C) Third round: result of superposition of fragments that remained ‘free’ after the previous iteration, an additional region in the CCA stem is found to be ‘well superimposed’ and is colored in cyan, regions that remain above the threshold of ‘good superposition’ remains shown in blue and orange colors. (D) The final superposition, in which the single-stranded CCA terminus (in the bottom left corner) is superimposed well and colored in cyan, while the superposition of other ‘free’ fragments (now shown in gray) does not improve according to SupeRNAlign; this superposition is used to generate the final sequence alignment.

