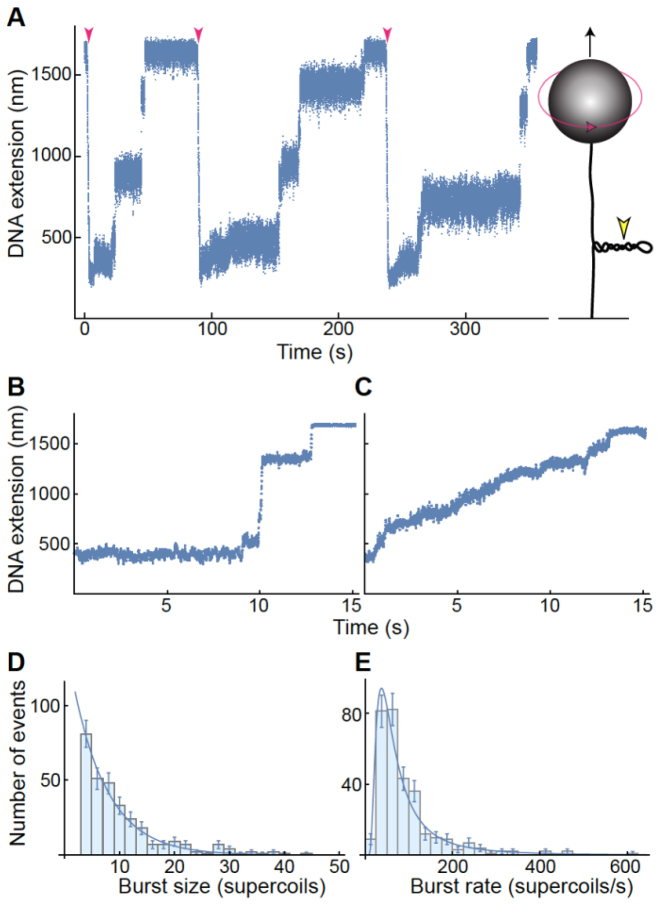
Figure 6.
Single-molecule measurements of Bacillus anthracis gyrase activity. Data are representative of measurements made on five individual DNA tethers on different days. (A) Representative trace of gyrase activity over time using magnetic tweezers. A cartoon of the experimental setup (not to scale) is shown at right: a single DNA molecule (black line) is torsionally constrained by attachment to a slide and manipulated by the attached magnetic bead (gray sphere). Both the upward force (black arrow) on the bead and its rotation (red arrow) are controlled through an externally applied magnetic field. Counterclockwise bead rotation increases the linking number of the DNA, generating positive supercoils. DNA extension (determined by bead height above slide surface) decreases in proportion to plectoneme supercoiling (yellow arrowhead). Results are shown at left for a single DNA molecule that was extended by a constant upward magnetic force of 1 pN. Upon introduction of 50 positive supercoils (red arrowheads), the DNA extension was reduced as a plectoneme formed. Gyrase removed supercoils in a series of discrete steps and the DNA returned to its initial length, initiating the onset of another measurement cycle. (B and C) Gyrase relaxes positive DNA supercoils in two distinct modes of activity. Representative traces in which the enzyme removed multiple supercoils either in rapid bursts (‘burst mode’ relaxation, B) or at a steady rate (‘steady mode’ relaxation, C), are shown. The DNA was under constant tension of 3.5 and 2.2 pN in B and C, respectively. (D and E) Characterization of burst mode relaxation. Distributions include measurements of 382 individual relaxation cycles in which 50 positive supercoils were removed. In each burst event, gyrase rapidly removed four or more supercoils. The burst size distribution (D) fits a single exponential curve. The burst rate distribution (E) fits an inverse gamma function with shape parameter α = 2.1 ± 0.2 and scale parameter β = 114 ± 11 supercoils/s. Error bars represent the square-root of the number of observed events; these errors were accounted for in the determination of the best-fit parameters (±SE).

