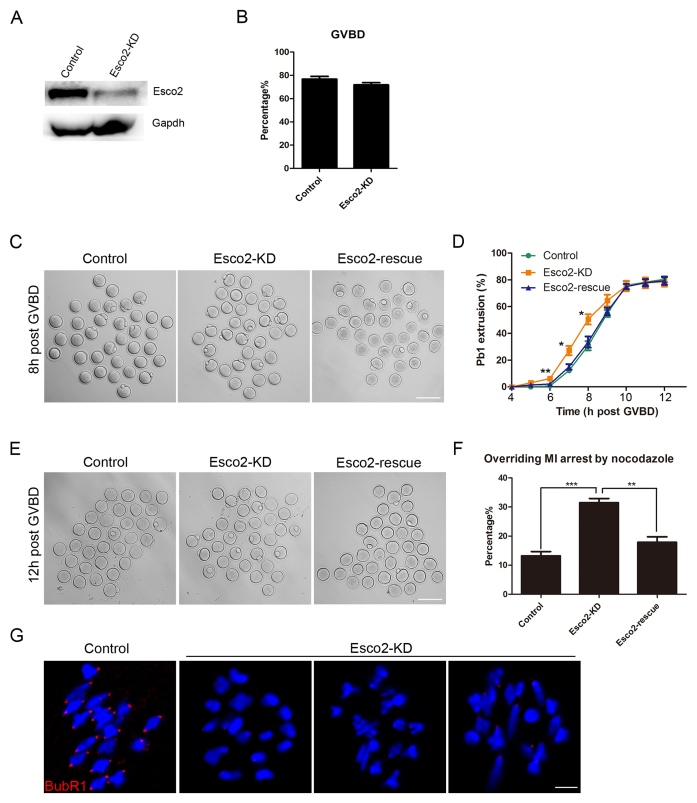
Figure 2.
Effects of Esco2 depletion on the meiotic progression and SAC activity in mouse oocytes. (A) Protein levels of Esco2 in control and Esco2-KD oocytes at M I stage were examined by western blot. (B) Quantitative analysis of GVBD rate was shown in control and Esco2-KD oocytes. (C) Representative images of first polar body extrusion(PBE) in control, Esco2-KD and Esco2-rescue oocytes at the time point of 8 h post-GVBD. Scale bar, 200 μm. (D) Quantitative analysis of PBE rate was shown in control, Esco2-KD and Esco2-rescue oocytes at consecutive time points of post-GVBD. (E) Representative images of first PBE in control, Esco2-KD and Esco2-rescue oocytes treated with low dose of nocodazole. Scale bar, 200 μm. (F) The proportion of overriding M I arrest was recorded in control, Esco2-KD and Esco2-rescue oocytes. (G) Localization of BubR1 at prometaphase I stage in control and Esco2-KD oocytes. Scale bar, 2.5 μm. Data of (B), (D) and (F) were presented as mean percentage (mean ± SEM) of at least three independent experiments. Asterisk denotes statistical difference at a P < 0.05 level of significance.

