Figure 3.
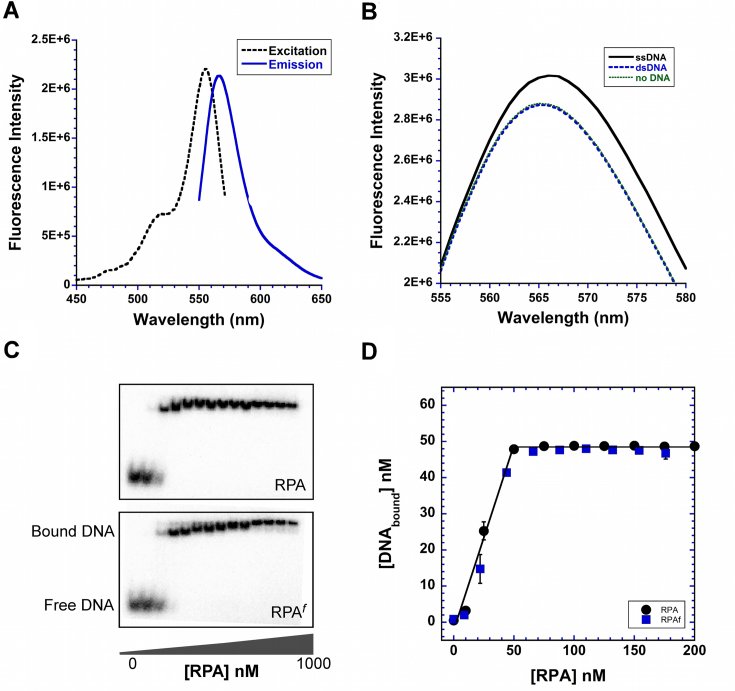
ssDNA binding properties of RPAf. (A) Excitation and emission spectra of RPAf show maximum values at 555 nm (λex) and 566 nm (λem). (B) RPAf was excited at 535 nm and emission spectra were recorded in the absence or presence of ssDNA [(dT)97] orplasmid dsDNA. A ∼5% increase in fluorescence signal is observed when ssDNA is present in the reaction. (C) Electromobility band shift analysis (EMSA) of RPAWT (top) and RPAf (bottom) binding to 50 nM 32P-labeled (dT)35 oligonucleotides show bound and unbound complexes and (D) quantitation of the EMSA data show stoichiometric binding to ssDNA for both RPA and RPAf.

