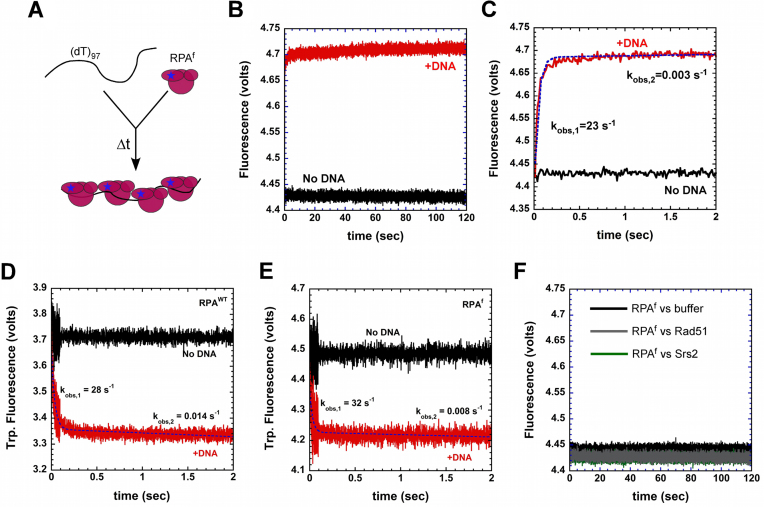
Figure 4.
Kinetics of RPA binding to ssDNA. (A) Schematic of stopped-flow experiment to capture RPA–ssDNA binding kinetics. (B) A rapid change in RPAf fluorescence is observed upon binding to a (dT)97 ssDNA oligonucleotide (red trace), whereas no change in fluorescence is observed in the absence of DNA (black trace). (C) Fit of the stopped-flow data (dashed blue line) show the presence of a rapid (kobs,1 = 23 ± 1.2 s−1) and slow phase (kobs,2 = 0.003 ± 0.0006 s−1) for ssDNA dependent changes in RPAf fluorescence. Intrinsic tryptophan fluorescence changes in (D) RPAWT and (E) RPAf upon binding to ssDNA reveal rapid changes in fluorescence and fit of the data yield kobs,1 = 28 ± 1.8 s−1, kobs,2 = 0.014 ± 0.004 s−1 for RPAWT, and kobs,1 = 32 ± 3.8 s−1, kobs,2 = 0.008 ± 0.003 s−1 for RPAf, respectively. (F) Free Rad51 or Srs2 in the reaction do not affect the basal fluorescence of RPAf.

