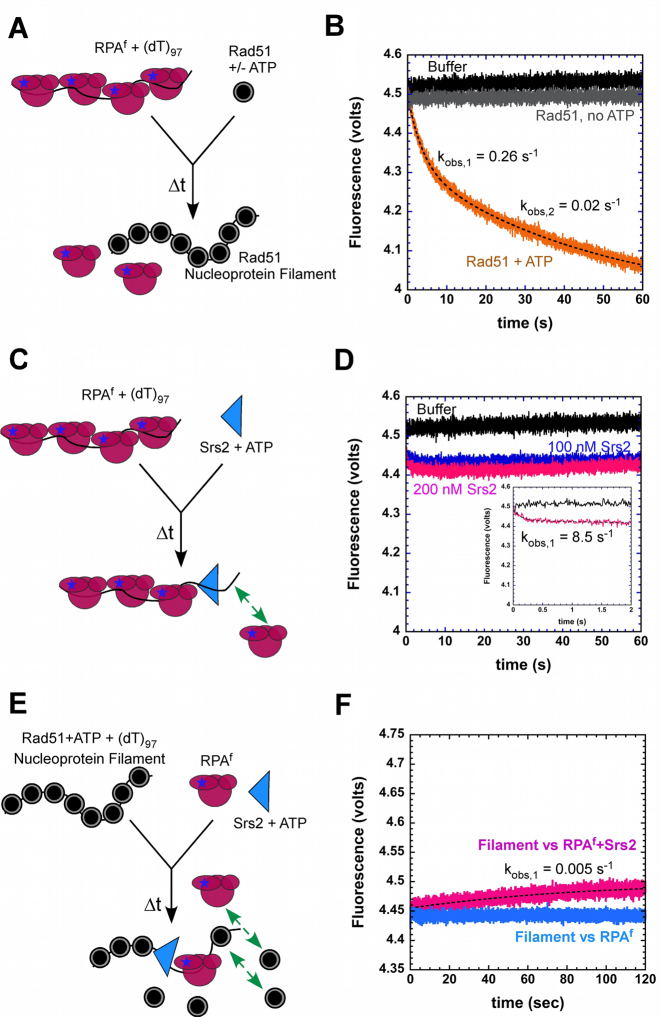
Figure 6.
Dynamics of RPAf during stages of homologous recombination. (A) Schematic of Rad51 binding to RPAf–ssDNA complexes. (B) Preformed RPAf–ssDNA complexes are not disrupted by Rad51 in the absence of ATP (gray trace), but effectively displaced in the presence of ATP (orange trace). The data is well described by a double exponential fit yielding kobs,1 = 0.26 ± 0.08 s−1 and kobs,2 = 0.02 ± 0.004 s−1. (C) Schematic of stopped-flow experiments to observe the effect of Srs2 on RPAf–ssDNA complex stability. The green arrow depicts potential rebinding of RPAf in the reaction. (D) Increasing concentrations of Srs2 show a small change in the fluorescence signal, but no significant change in overall fluorescence is observed. Insert shows an exponential phase with an observed rate constant of 8.5 ± 0.8 s−1. (E) Schematic of events during filament disassembly. The green arrows denote removal of RPAf upon Rad51 rebinding. (F) In filament clearing experiments, a preformed Rad51 filament prevents RPAf from binding to ssDNA (blue trace), however, when Srs2 is present in the reaction, a gradual increase in fluorescence is observed (pink trace) highlighting clearing of Rad51 molecules from ssDNA by Srs2 followed by RPAf binding to ssDNA. The data displays a single exponential profile (dotted line) with kobs = 0.005 ± 0.001 s−1.

