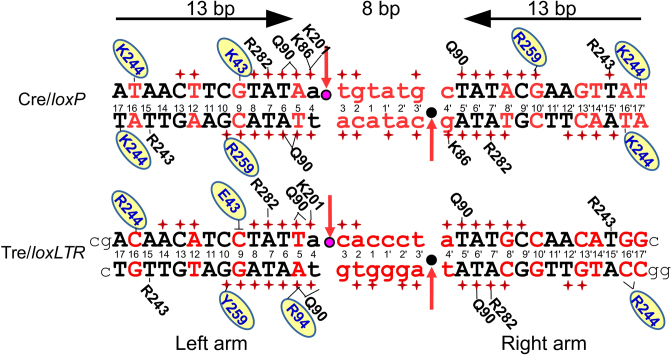
Figure 1.
Sequence of loxP and loxLTR recombination sites and schematic comparison of protein–DNA interactions for Cre/loxP and Tre/loxLTR. DNA sequences are black (conserved between loxP and loxLTR) or red (not conserved). Standard loxP numbering is shown. Lower case letters indicate the central 8-bp spacer region. The horizontal arrows indicate the orientation of the inverted repeat sequences in loxP and highlight the symmetry in the loxP target. The scissile phosphates are indicated by pink and black circles in the active and inactive arms, respectively. Red arrows indicate site of cleavage. Phosphate backbone interactions are indicated by a red +. Only residues involved in base-specific interactions are shown and are placed adjacent to the interacting base, with a solid line drawn to the base for clarity. Residues in blue letters on yellow oval indicate amino acid sequence difference between Cre and Tre. The ┴ indicates the loss of an interaction. The black lower case letters at the ends of the loxLTR sequence show the additional nucleotides used for crystallization of the Tre/loxLTR complex. The PDB ID: 3C29 was used for the Cre/loxP analysis (except for the K201 interaction which was 1NZB).

