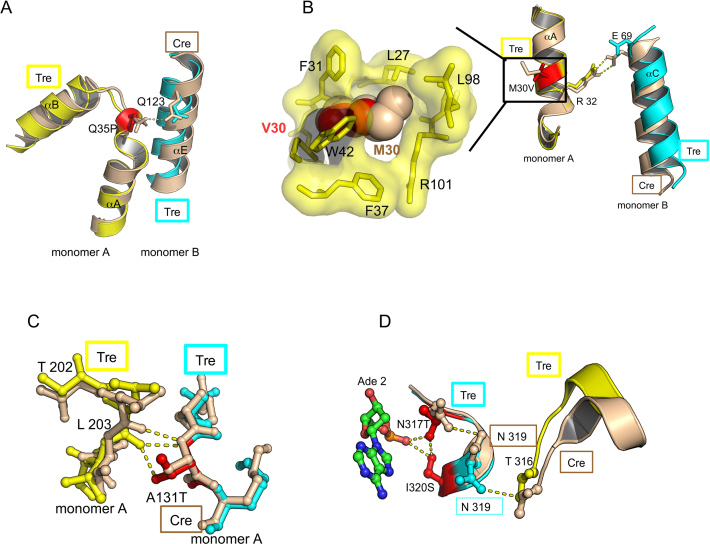
Figure 10.
Tre mutations not involved in sequence-specific DNA interactions. (A) Close-up of Tre Q35P mutation. This view highlights loss of an intermolecular Gln 35 and Gln 123 hydrogen bond in the Q35P mutation. The mutated residues are colored red. Tre (yellow and cyan) and Cre (tan) are superimposed. Hydrogen bonds and salt bridges are shown by yellow dashed lines. (B) Close-up of Tre M30V mutation at protein–protein interface. This view highlights loss of salt bridge between Arg 32 in Glu 69 in the Tre/loxLTR complex. A close-up of the boxed portion shows the cavity formed by Val 30 (red spheres) versus Met 30 (tan spheres) (C) Close-up of Tre A131T mutation. This view highlights additional inter-molecular hydrogen bond in Tre between Thr 131 and Leu 203. (D) Close-up of N317T, I320S Tre mutation. This view highlights new intra- and intermolecular polar interactions.

