Figure 4.
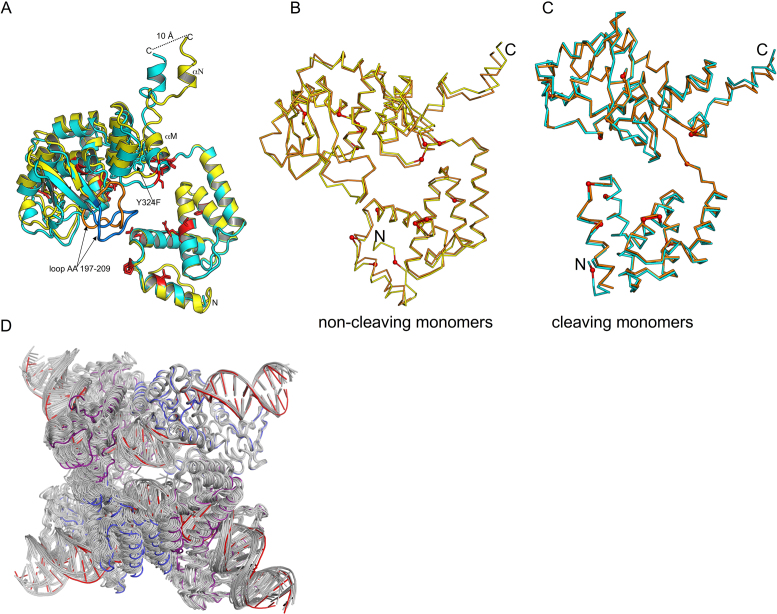
Superposition of cleaving and non-cleaving conformers of Tre. (A) The N-terminal domains of cleaving conformer (cyan) and the non-cleaving conformer (yellow) are superimposed (RMSD ∼0.4 Å). The C-terminal domains differ by ∼6° rotation, and superimpose less well (RMSD ∼2.7 Å). The mutations relative to Cre are shown as red sticks. The conformational changes result in a displacement of the helices M and N at the C-terminus. The loop region (AA 197–209) also exhibits a large conformational change (∼14 Å distance between Thr 206). This loop is colored orange (non-cleaving conformer), and blue (cleaving conformer) for clarity. (B) Comparison of non-cleaving Tre and Cre conformers. Non-cleaving conformer of Tre (yellow) and Cre (orange) were superimposed. The location of Tre mutations are shown as small red spheres. (C) Comparison of cleaving Tre and Cre conformers. Cleaving conformer of Tre (cyan) and Cre (orange) were superimposed. The PDB ID used in this superposition was 3C29. (D) Superposition of Tre and other Cre structures. For each Cre tetramer, a Cre cleaving conformer was superimposed onto the Tre cleaving conformer. The results are displayed as a ribbon diagram with Cre/loxP colored gray and Tre cleaving and non-cleaving conformers colored blue and purple, and loxLTR colored red. The PDB IDs of the Cre/loxP structures used in this superposition are 1NZB, 4CRX, 5CRX, 3C28, 3C29, 1Q3U, 2HOF, 2HOI, 1Q3V, 1OUQ, 1CRX, 3MGV, 1PVP, 1PVQ, 1PVR, 1MA7. Note that Tre is often at the extreme ‘edge’ of the range of variability seen for the other Cre structures.

