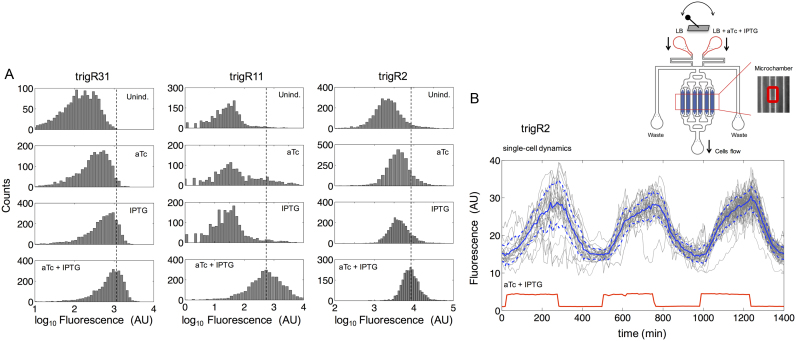
Figure 5.
Functional characterization of designer RNA hybridization networks in single bacterial cells. (A) Fluorescence distributions of multiple individual cells obtained by flow cytometry for systems trigR31, trigR11 and trigR2. Unind., uninduced. (B) Dynamic single-cell tracking of fluorescence (arbitrary units, AU) in one microchamber of the microfluidics device under time-dependent induction with IPTG and aTc for system trigR2 (∼100 cells). Both inducers were applied with a period of 8 h (i.e. 4 h induction/ON and 4 h relaxation/OFF; square wave). The solid and dashed lines (in blue) correspond to the mean and plus/minus the standard deviation for the entire cell population, respectively. Sulforhodamine B (red fluorescent dye) was used to monitor the inducer time-dependent profile (in red). A scheme of the device is shown at the top of the panel. Bacterial cells are trapped in the microchambers (zoomed in) and exposed to a continuous flow of media, either LB or LB with inducers (switching controlled with pumps).

